When a database contains many sheets interconnected through features like Multiple Versions, Link and Load, New Sheet From Subtable, or Show References From Existing Sheets, you can generate a Sheet Relationship Diagram to visualize relationships between sheets and better manage your database.
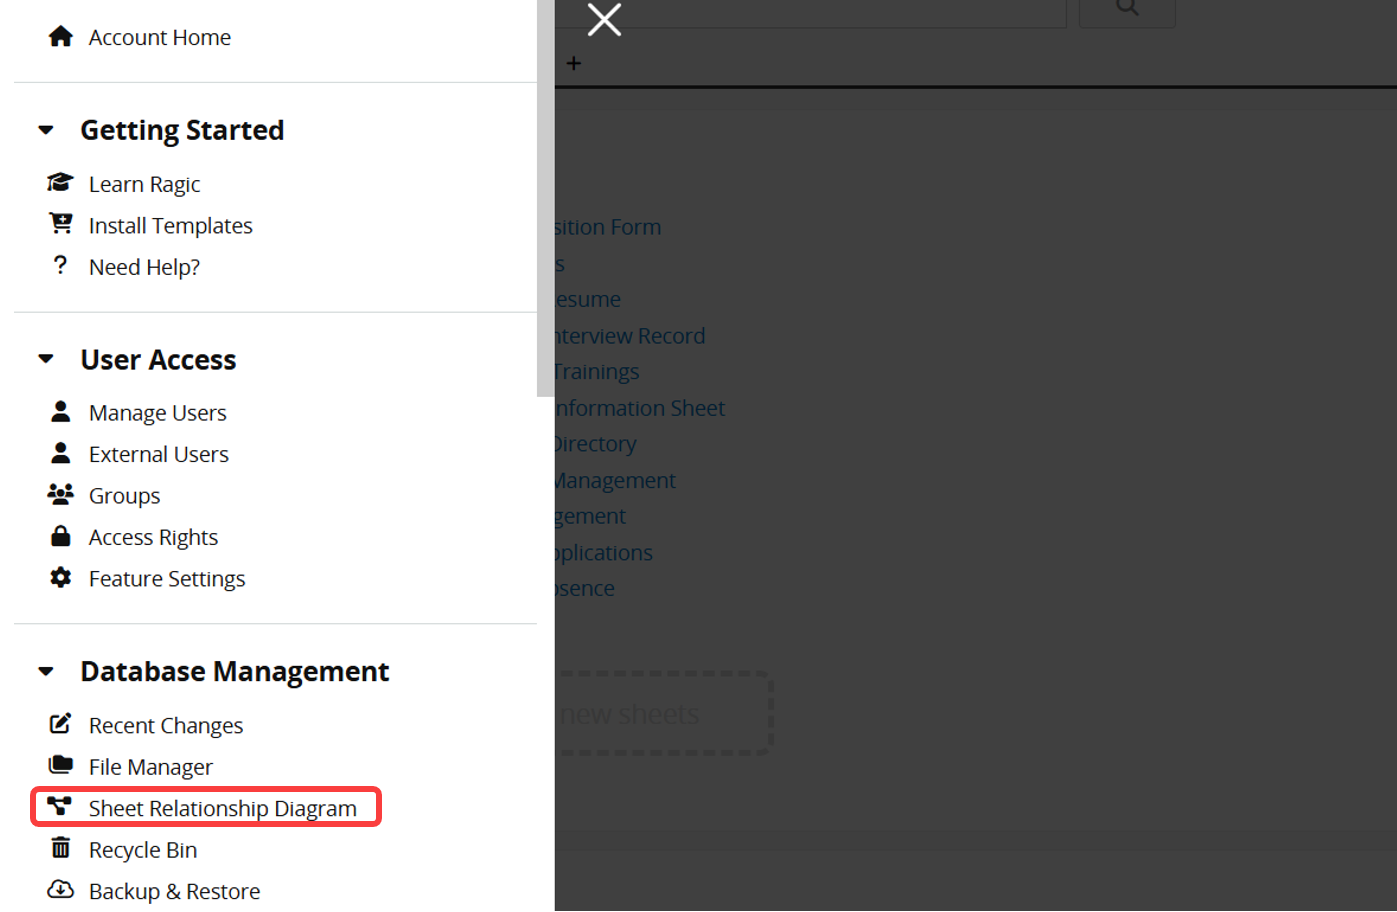
Navigate to the hamburger icon in the upper left corner of the page and select Sheet Relationship Diagram under Database Management.
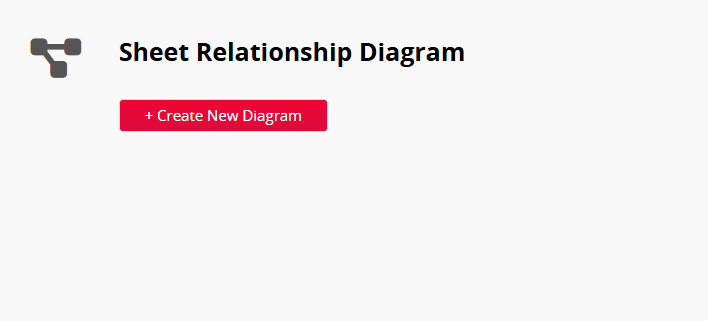
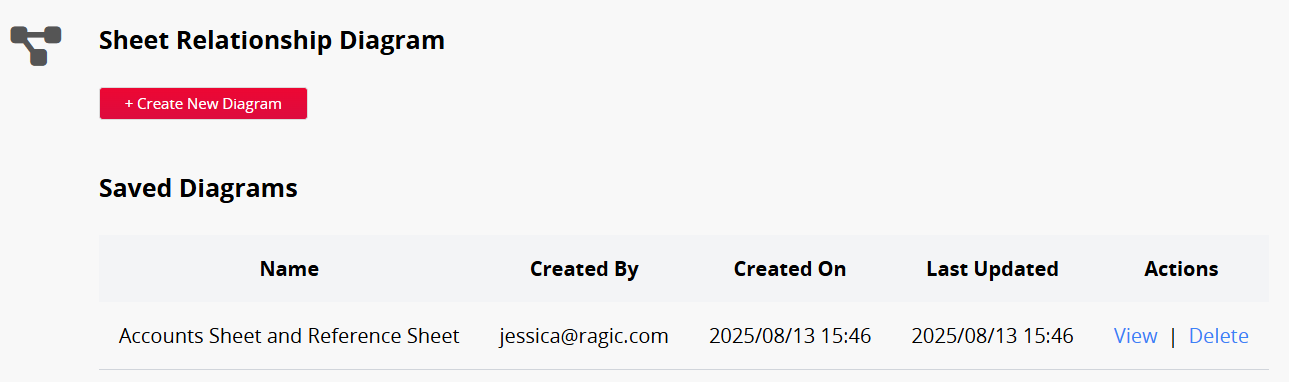
1. Click Create New Diagram.
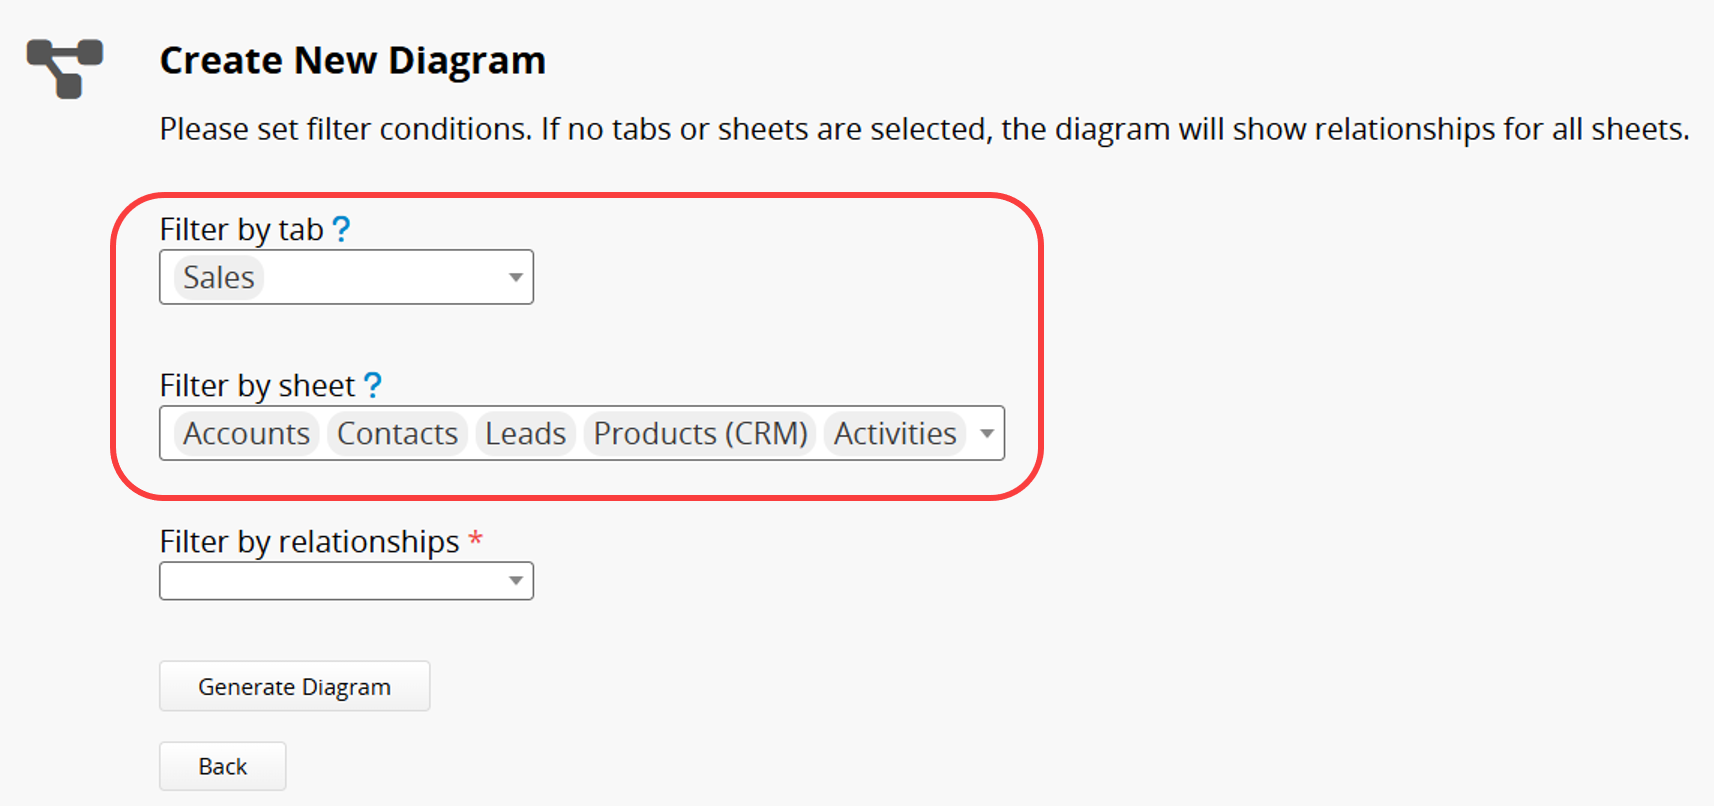
2. Set the filter conditions.
No filter: Displays the relationship diagram of all sheets in the database.
Filter by tab only: Shows relationships for all sheets under the selected tab.
Filter by sheet: Shows all related sheet relationships starting from the selected sheet.
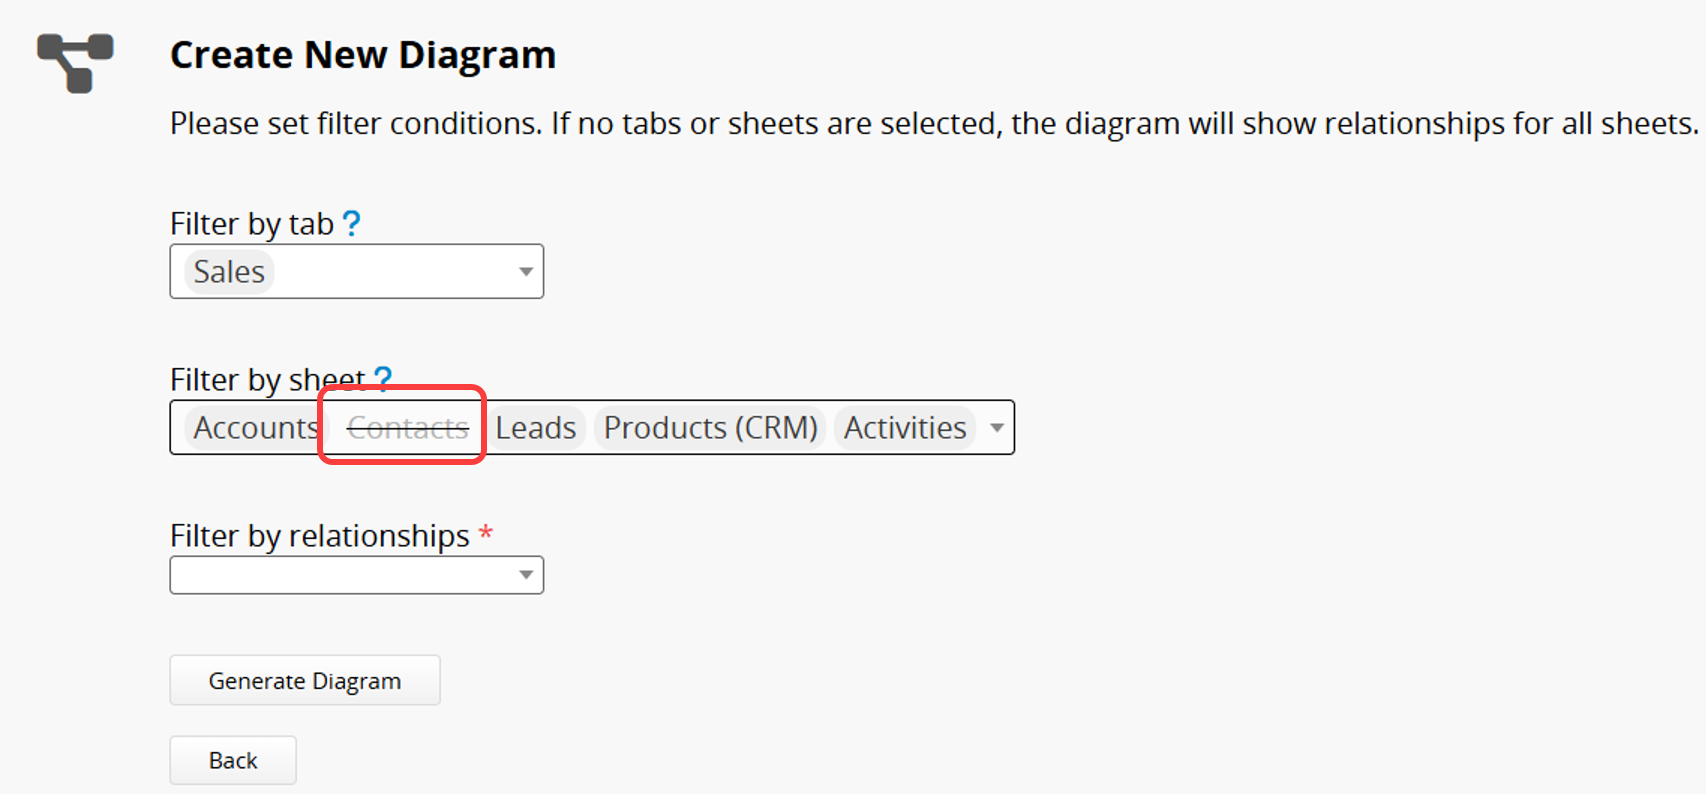
You can click a tab or sheet name to remove it from the filter.
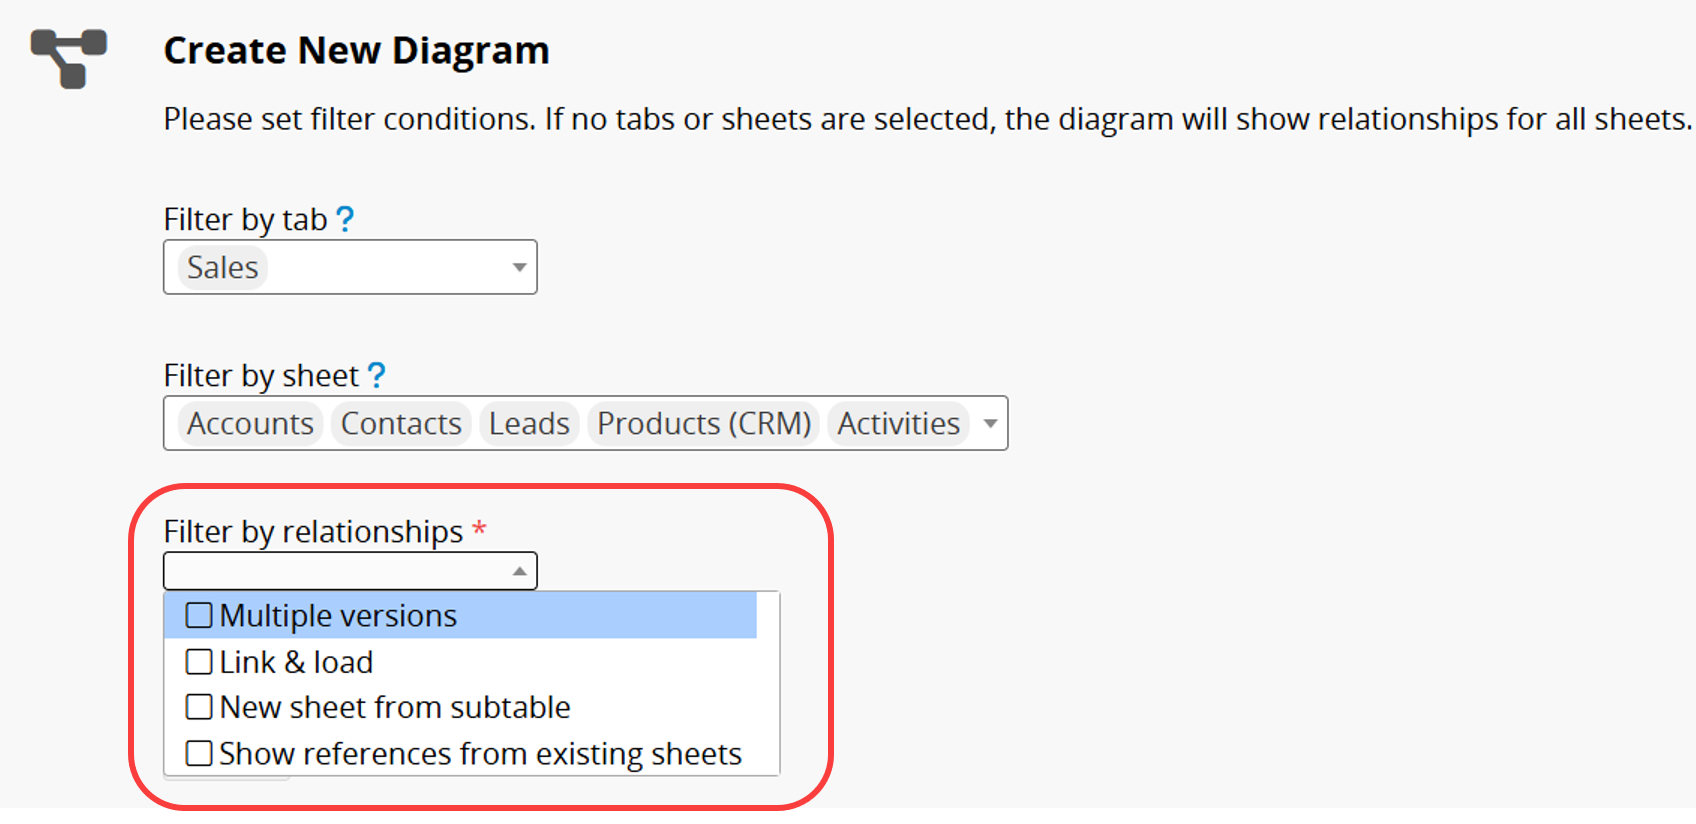
3. Set the Filter by Relationships.
Choose which relationships to include: Multiple Versions, Link and Load, New Sheet From Subtable, or Show References From Existing Sheets.
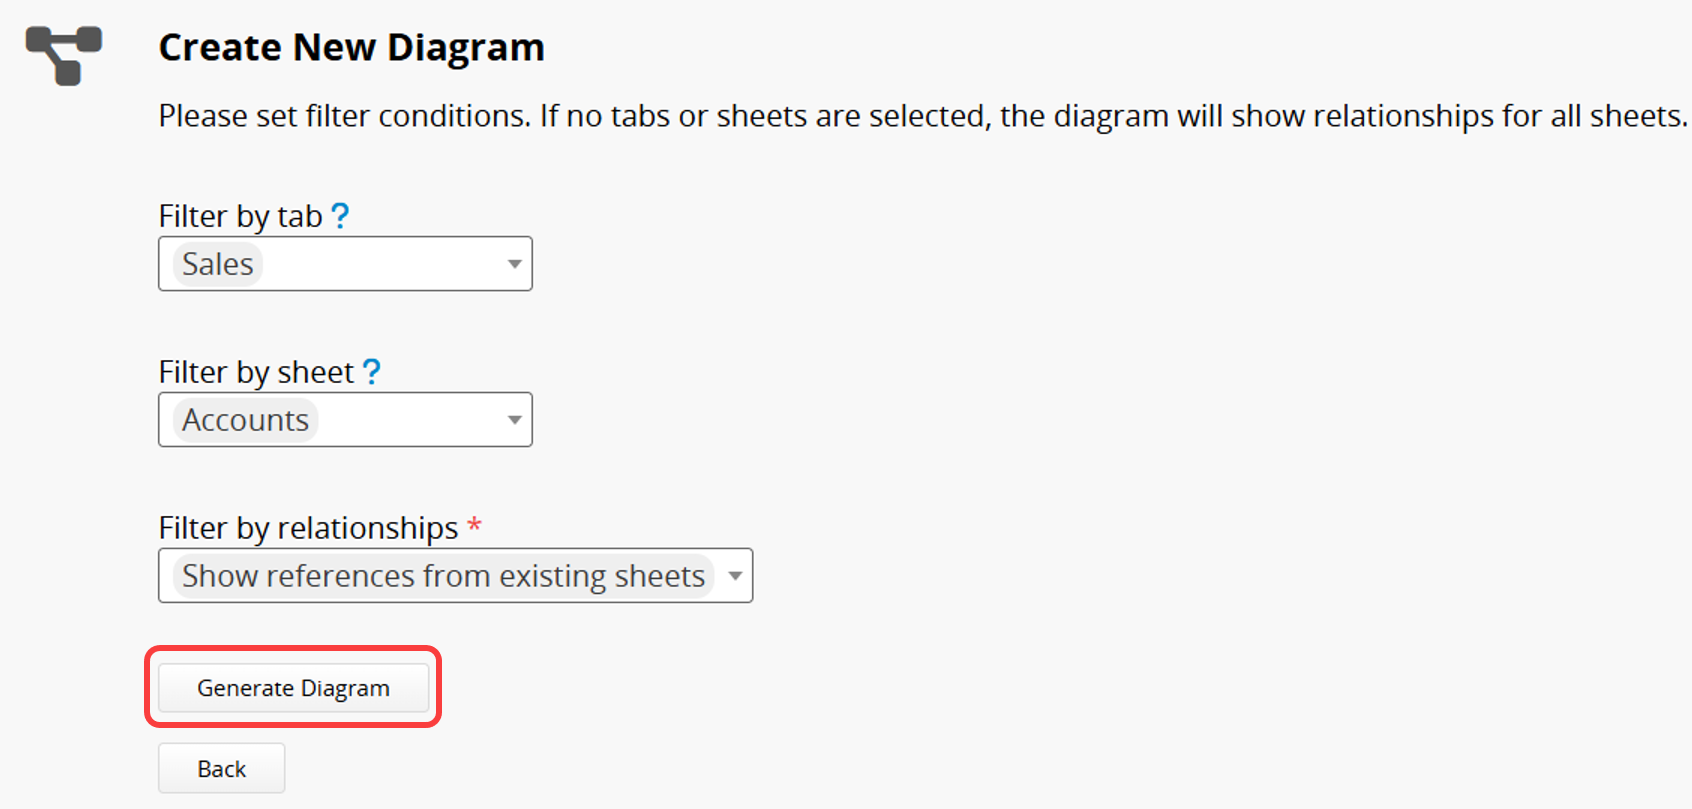
4. Click Generate Diagram to create the diagram in the preview window below.
In the diagram, you will see the filtered sheets, tabs, and related sheets that have relationships with them. Sheets under different tabs will be displayed in different colored boxes for easier identification.
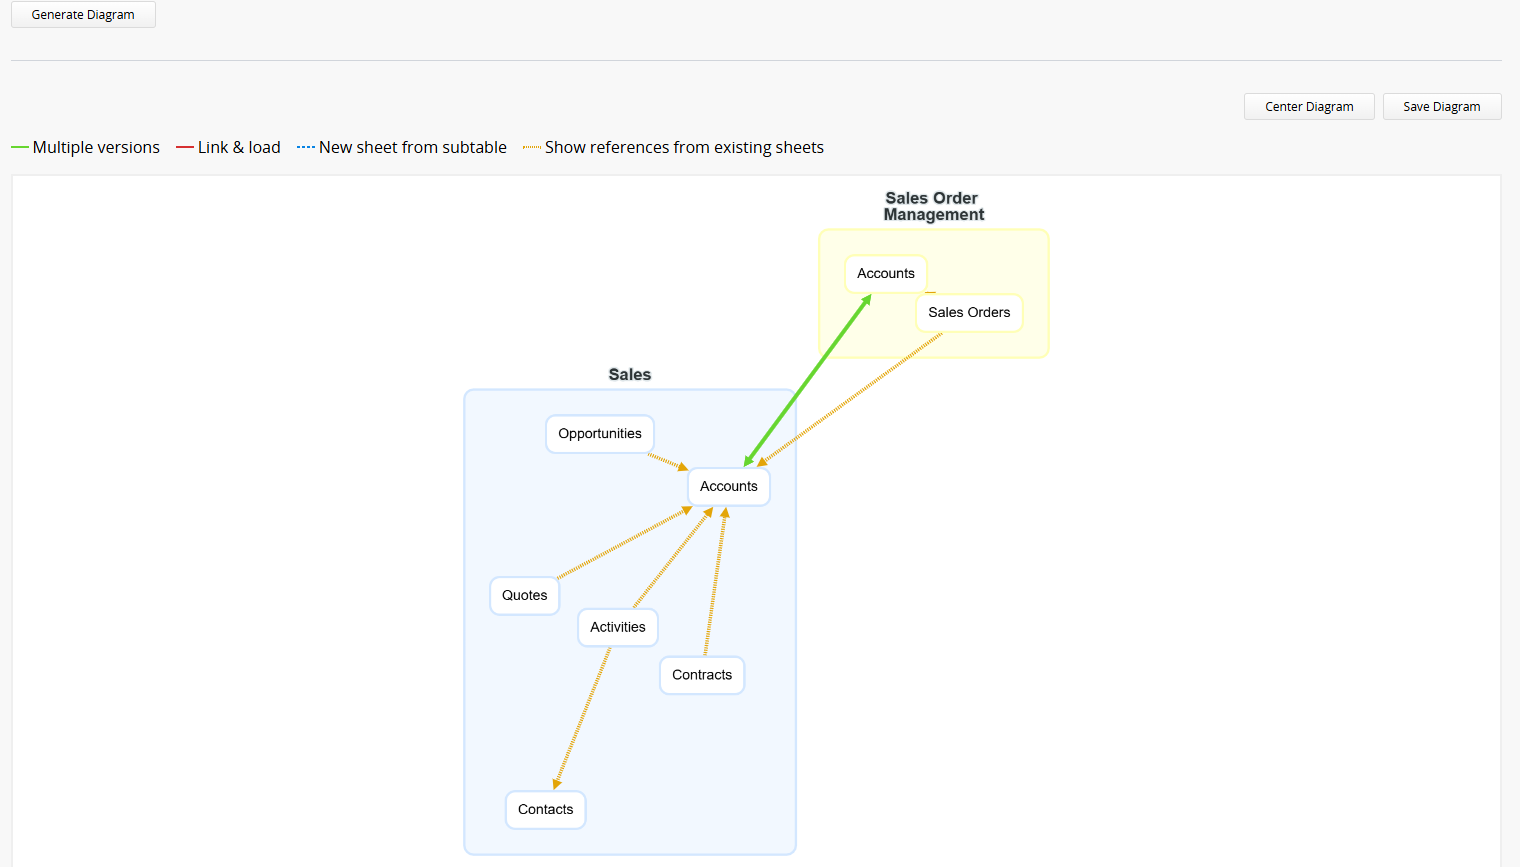
You can use the mouse scroll wheel to zoom in or out, and drag tabs or sheet boxes to reposition them. Click the Center Diagram to restore it to its original size and position. Clicking a sheet name will open it in a new browser tab.
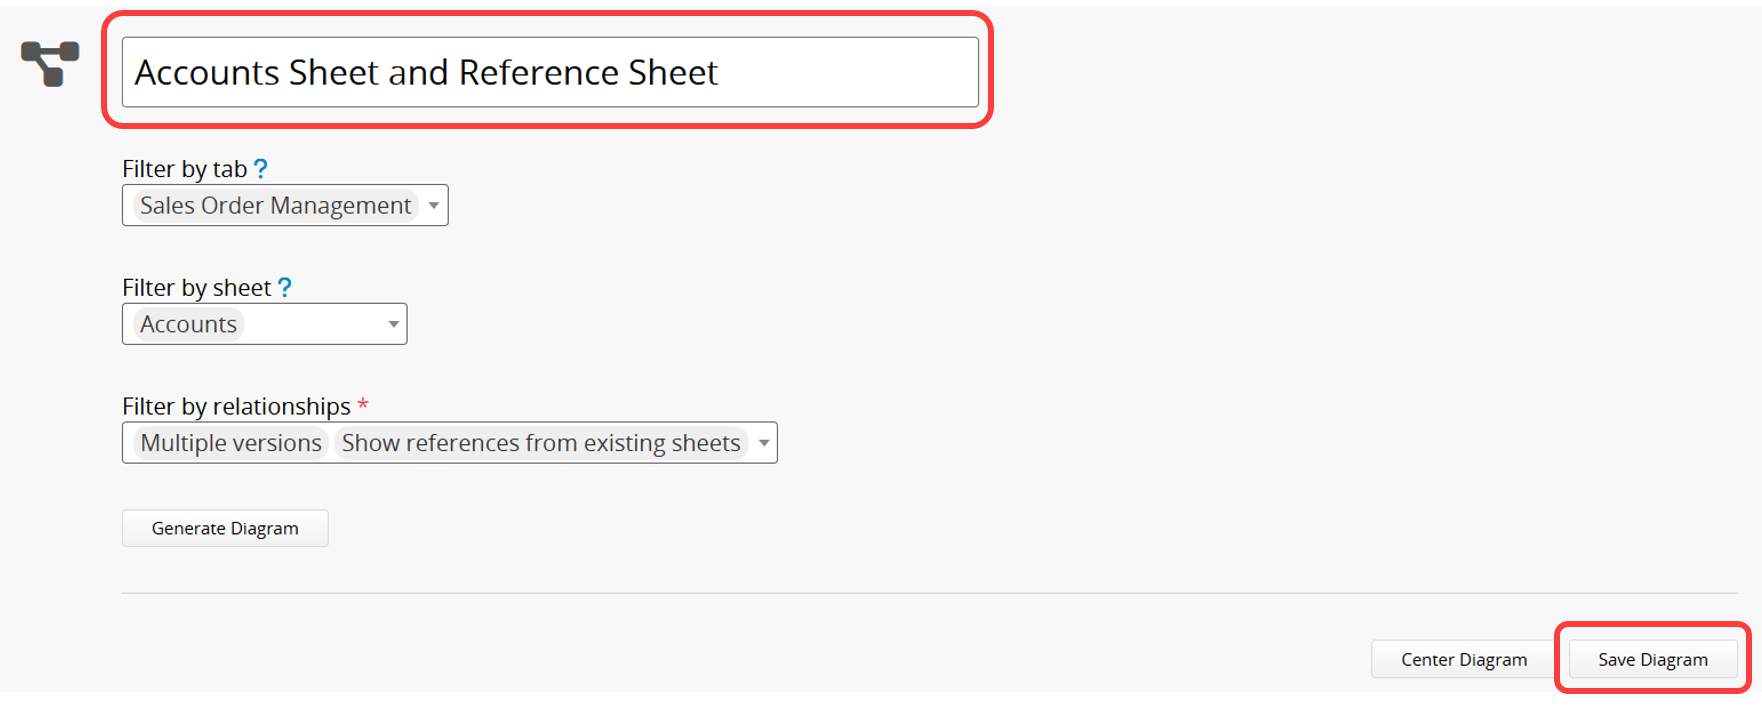
After adjusting, name the diagram at the top and click Save Diagram.
When you return to the Sheet Relationship Diagram page, you can view saved diagrams or delete those you no longer need.
1. Only SYSAdmins have access to the Sheet Relationship Diagram feature.
2. A diagram can only be updated and saved by its creator. Other SYSAdmins can view it but cannot make changes.
 Thank you for your valuable feedback!
