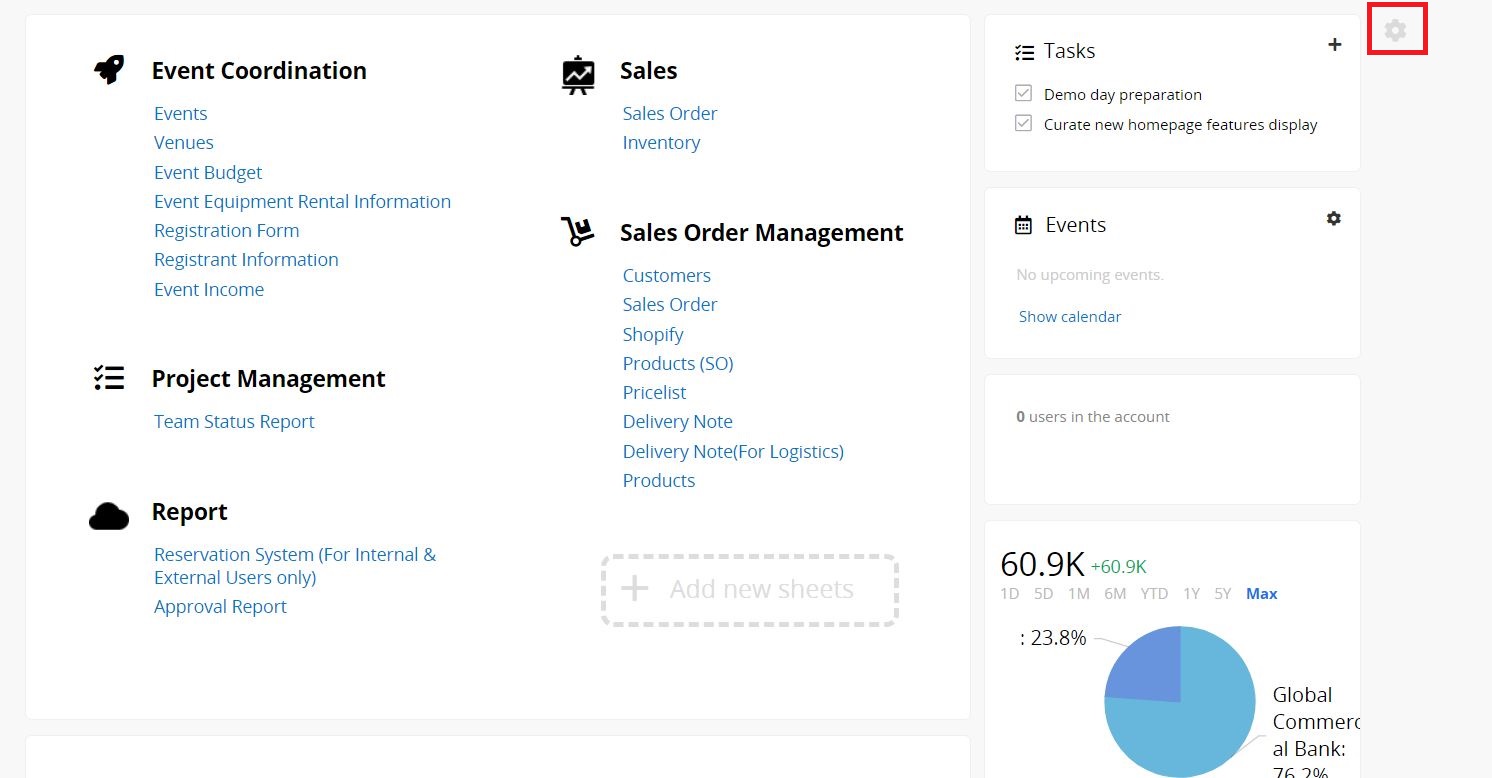
Click on the gear icon on the upper-right of the page to start customizing your database's homepage.
On this page, you can click + to add sections or columns, and drag the borders between columns to adjust their widths.
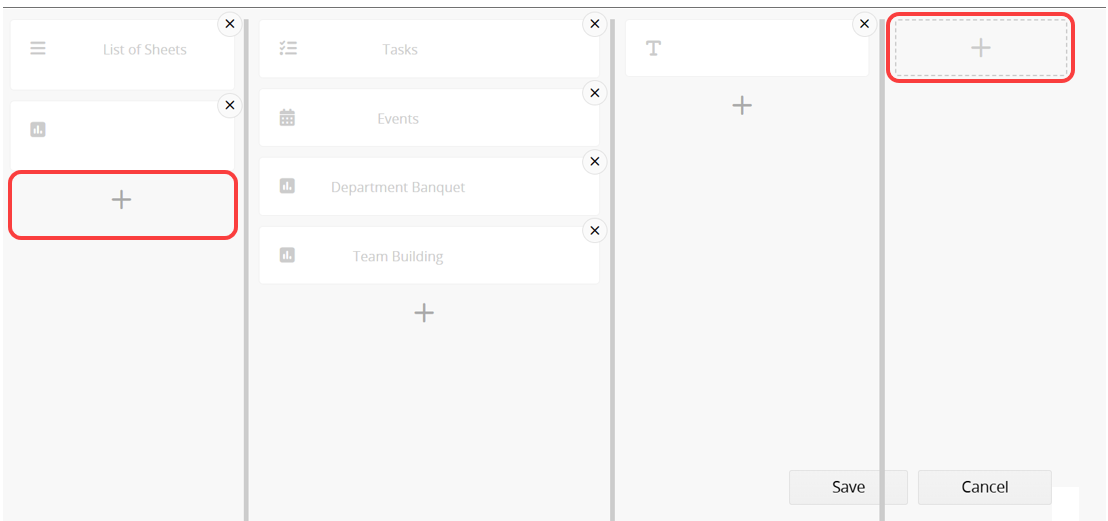
After adding a section, click it to configure the settings. You can click the X in the upper right corner to remove the section, or drag and drop sections to reorder them on the homepage. However, sections can only be moved within the same column. For example, you cannot move a section from the left column to the right column. Remember to save your changes when finished.
You can also set Groups with access for each section, making certain sections visible only to specific User Groups.
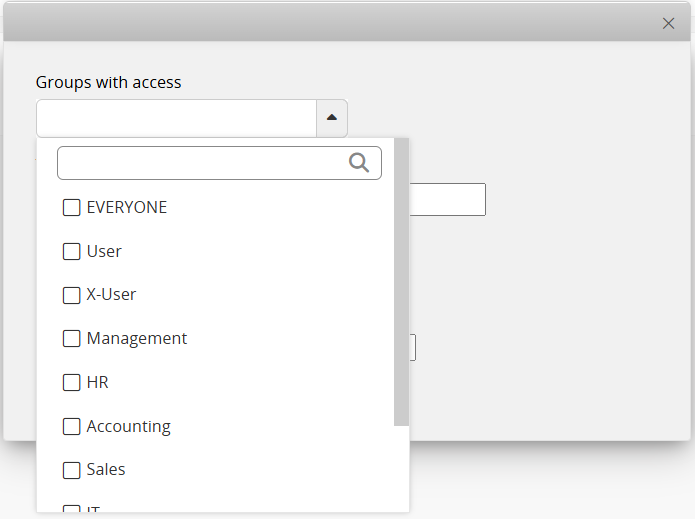
By default, Internal Users can view all, while External Users cannot see any.
Exceptions are the following three sections:
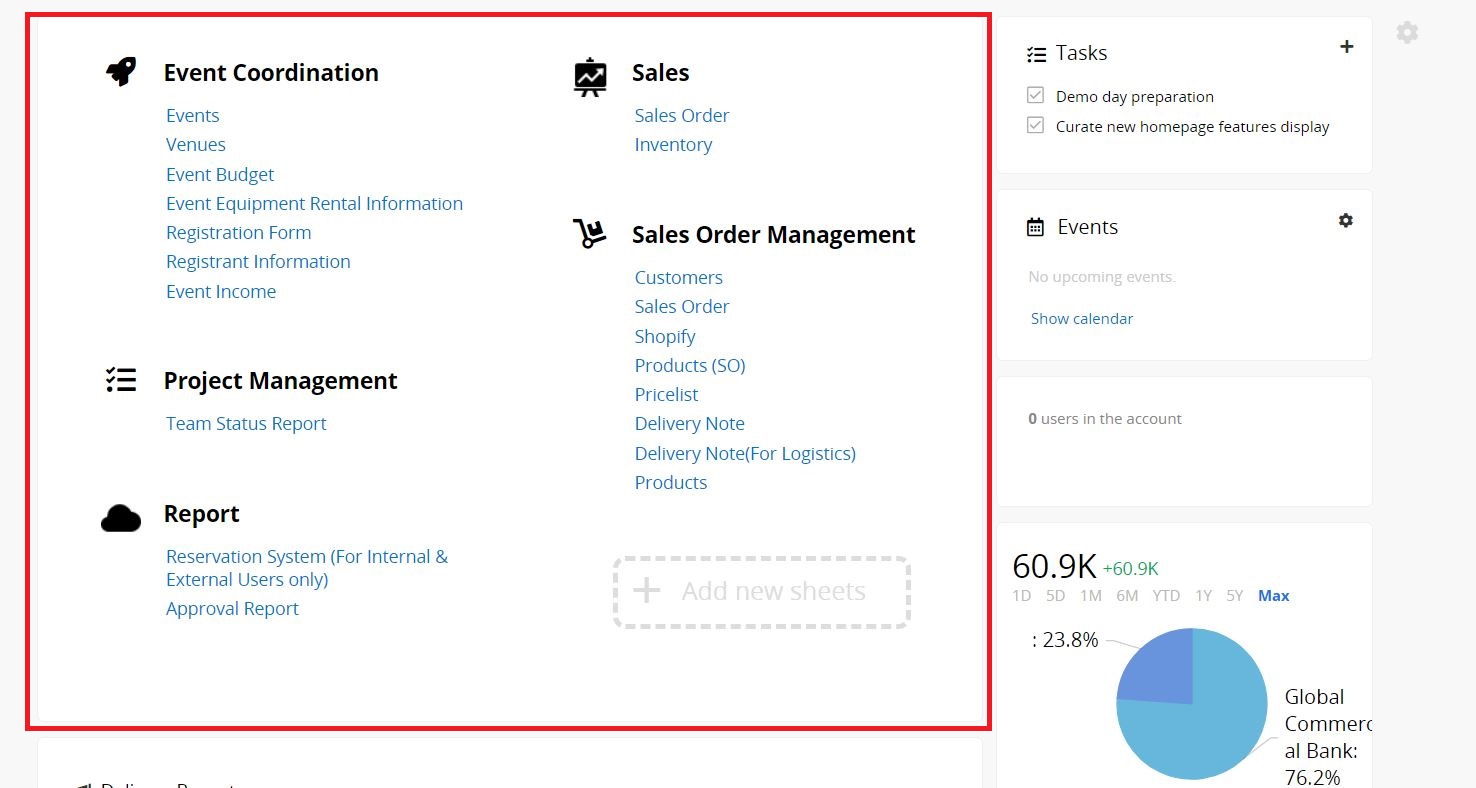
1. List of Sheets: Set to Everyone by default.
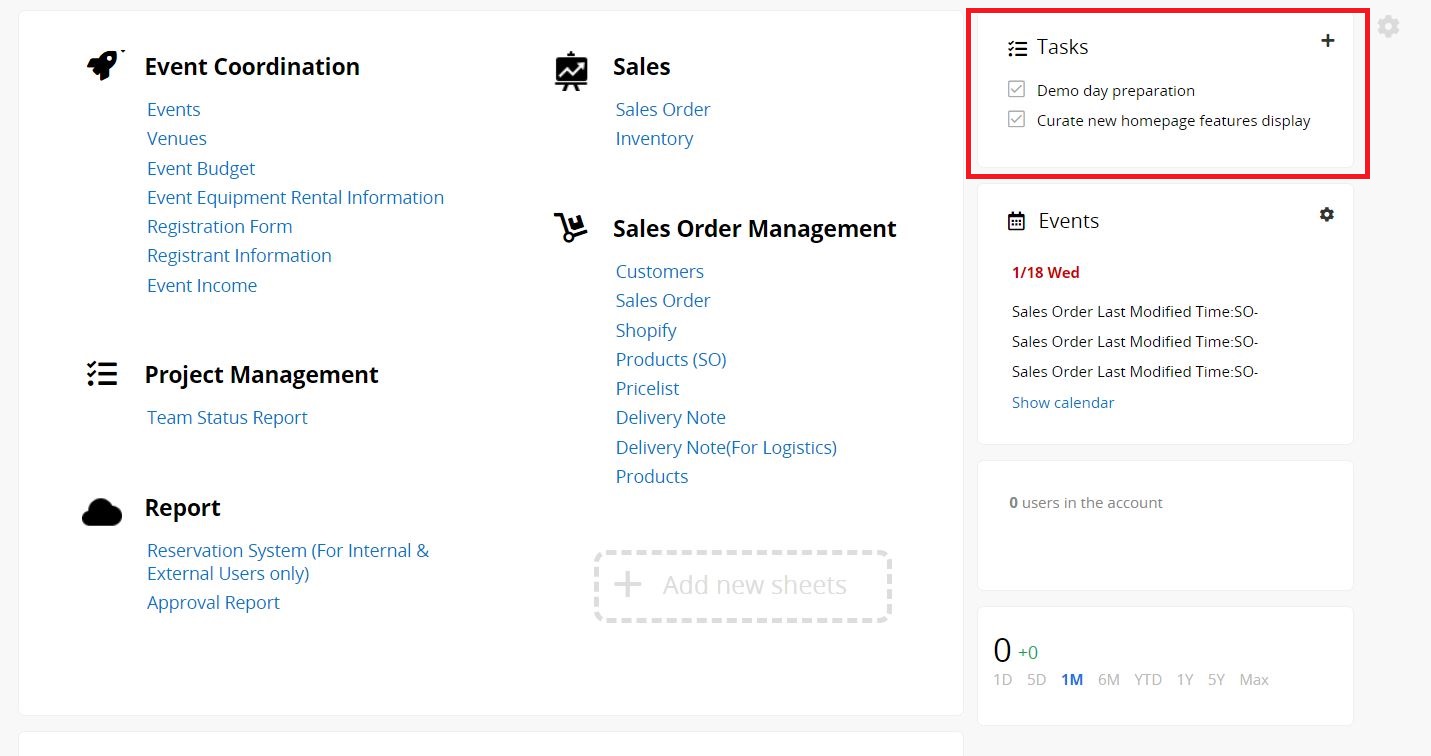
2. Tasks: Synchronized with user groups in Feature Access Settings.
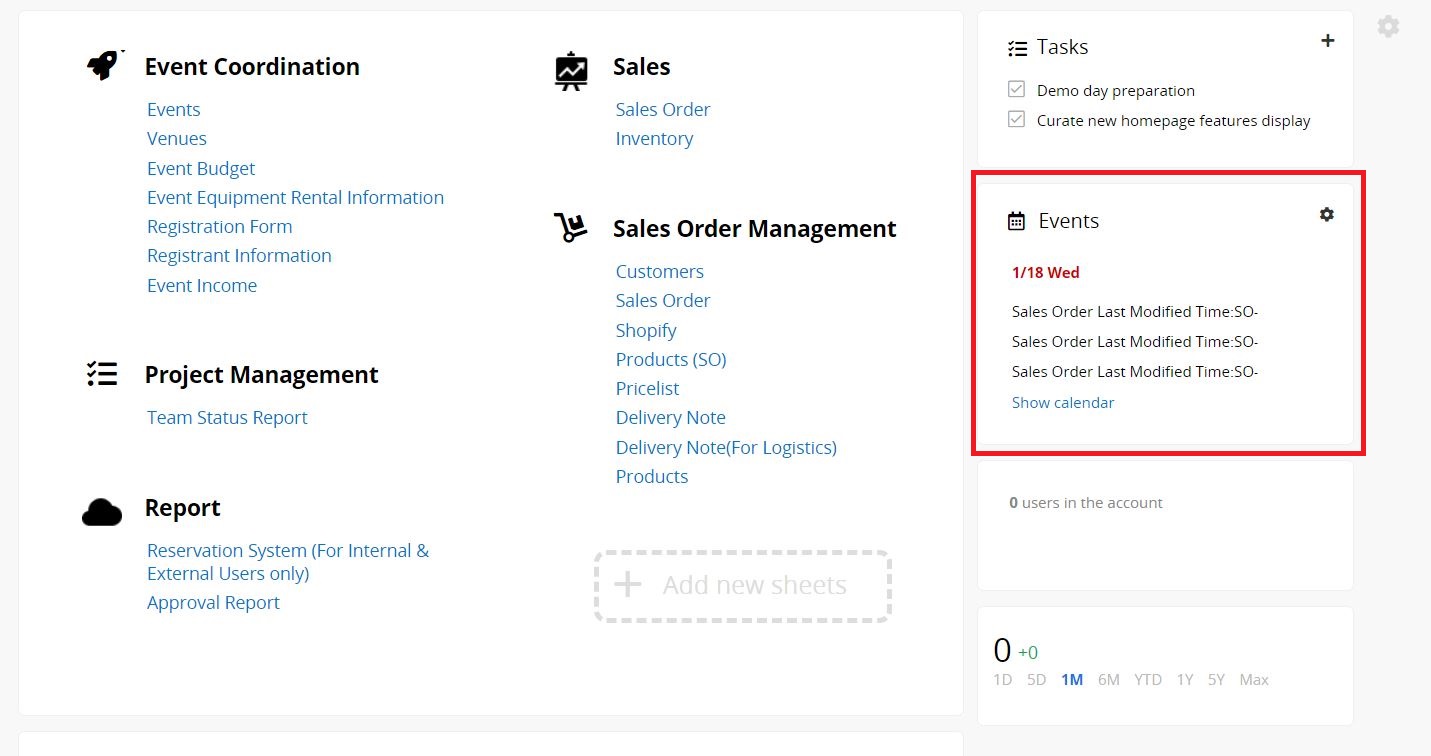
3. Events: Synchronized with user groups in Feature Access Settings.
Currently, we support 10 different sections.
List all the tabs and sheets in your database.
Events on your homepage list up to 10 records with a date field where the date is within the next seven days.
Tasks is the to-do list for each user, it can be generated from the system or manually assigned.
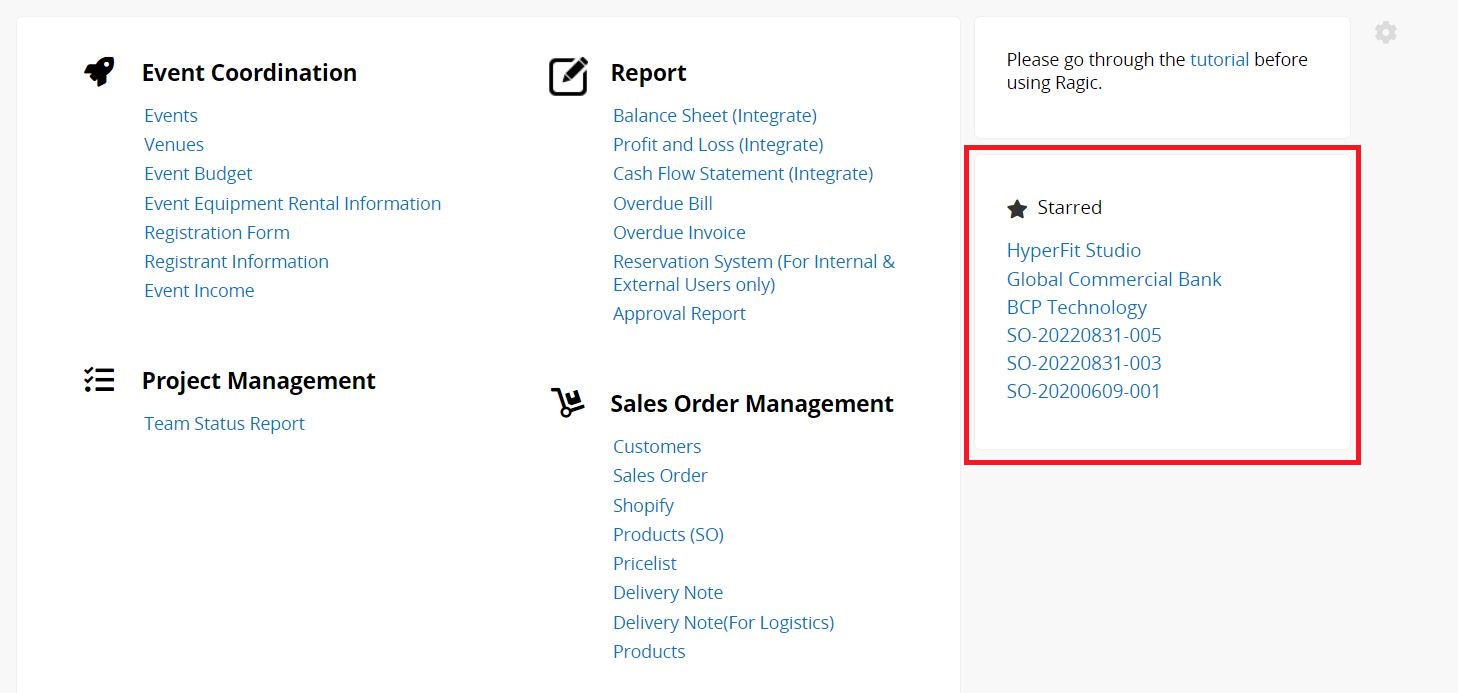
Show the Title Field of all starred records from all sheets.
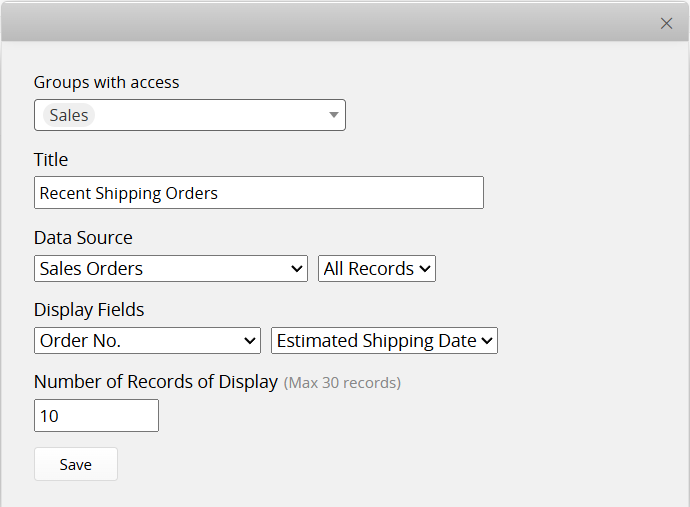
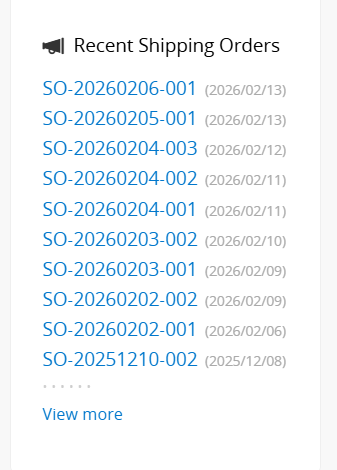
Show records from a specified sheet. You can configure the groups with access, select the two display fields, and set the number of records to display.
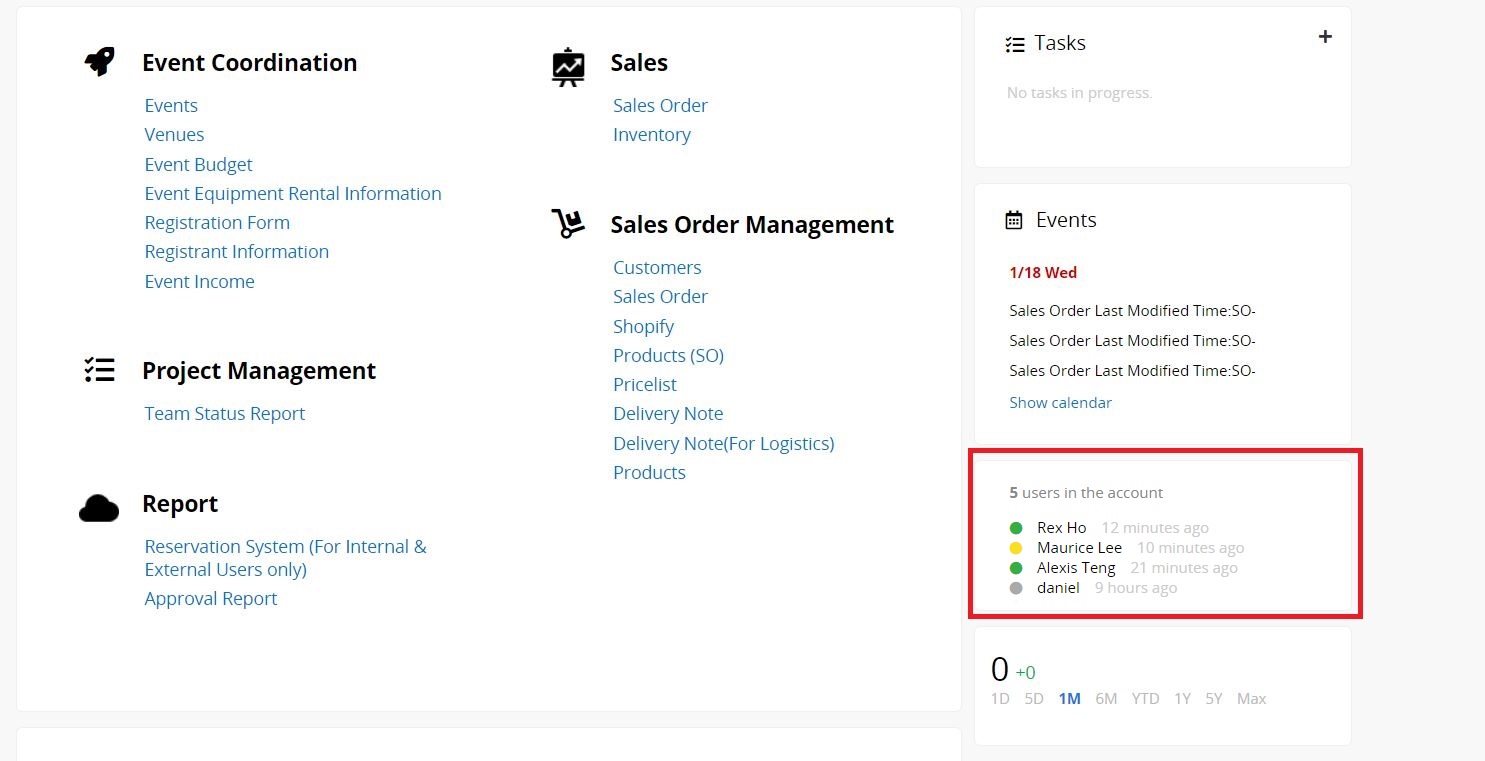
List all users who are currently online and their last log-in time.
Green: Online
Yellow: Idle for more than 3 minutes
Grey: Idle for more than 30 minutes
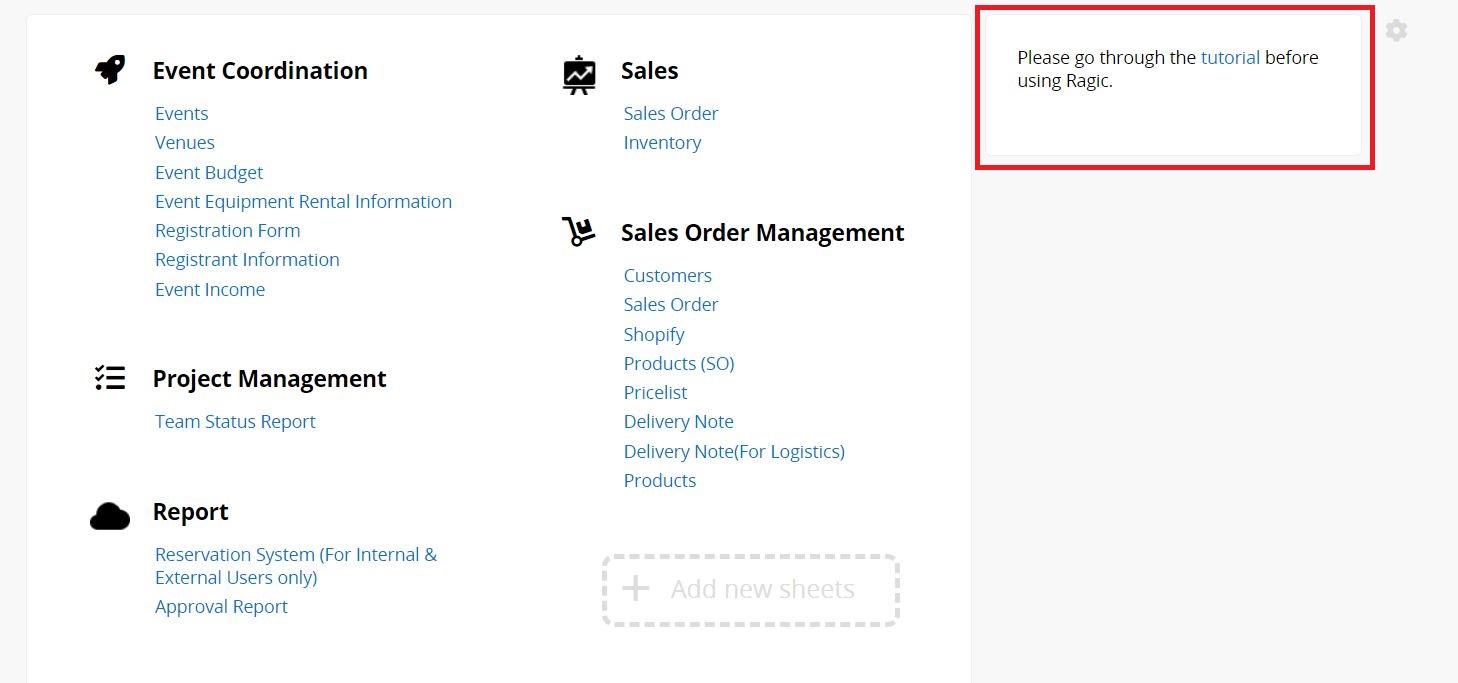
Enter any text and set whether to enable automatic wrapping. BBCode is supported, so you can insert images, videos, or hyperlinks as well.
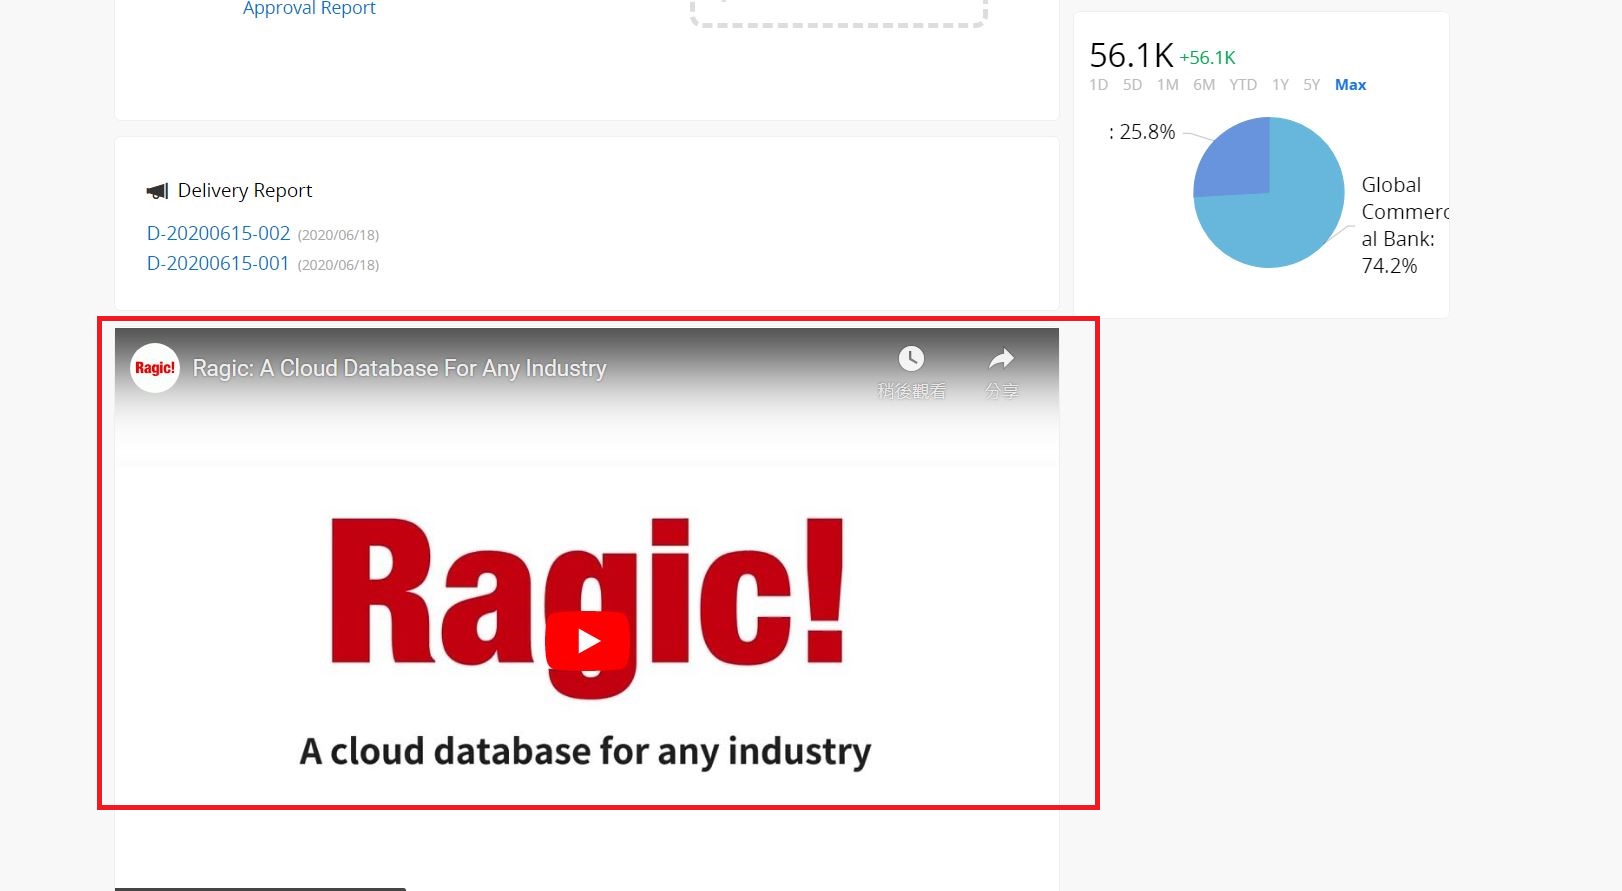
Fill in a URL to embed its content in this section, such as embedding Google Calendar, YouTube videos, etc. For common embedding methods, please refer to this article.
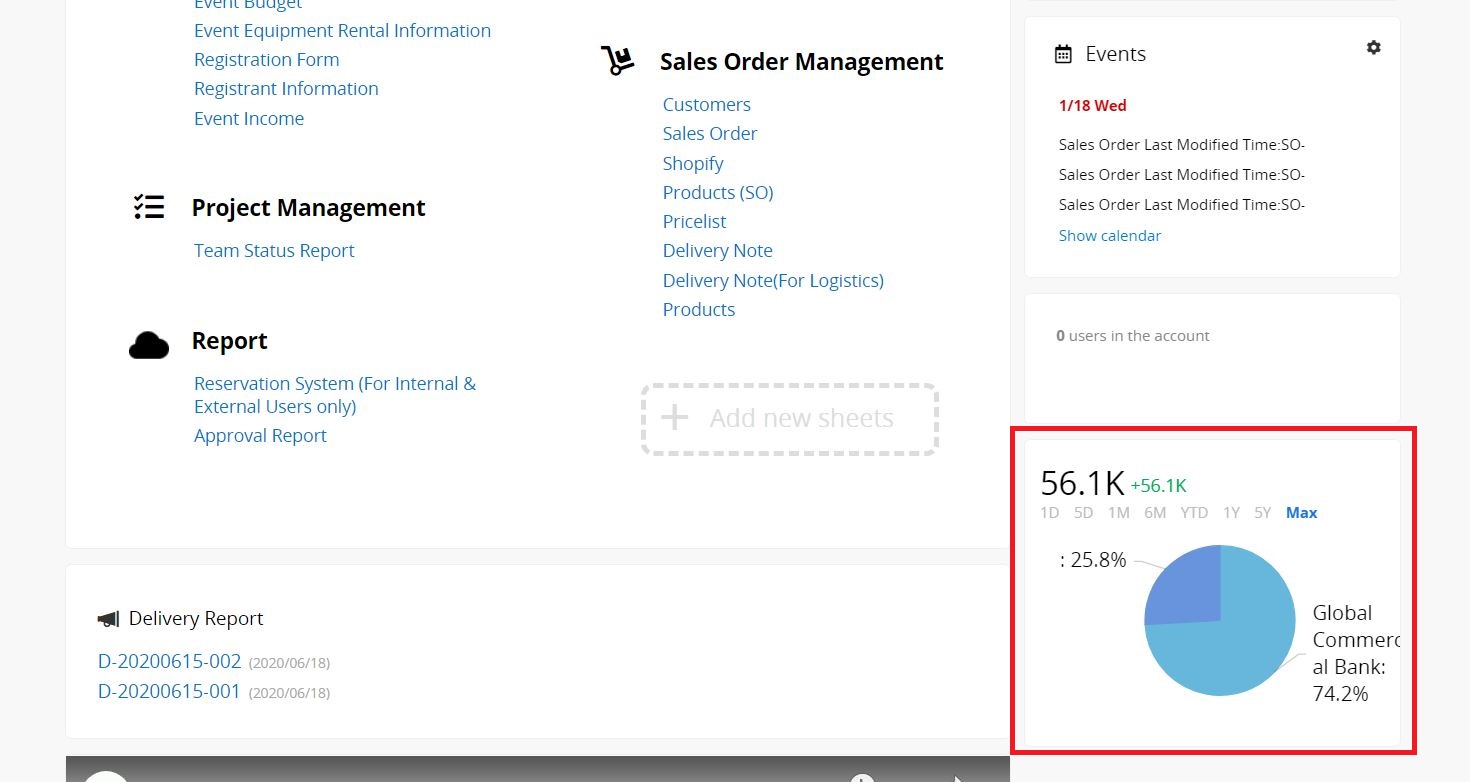
Insert a Widget on your homepage for data visualization, such as using a pie chart to display revenue by sales reps or revenue growth trend next to sales data.
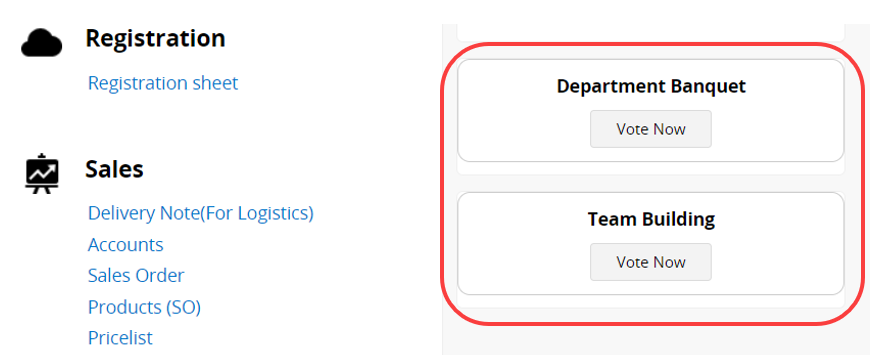
Besides being able to create Polls within sheets, you can also create them directly on the homepage. For example, during company events, you can allow employees to vote directly on the homepage.
You can configure access rights for the Most Visited, and Recent Items on the left sidebar of the homepage, and Personal View within sheets from the Feature Access Settings.
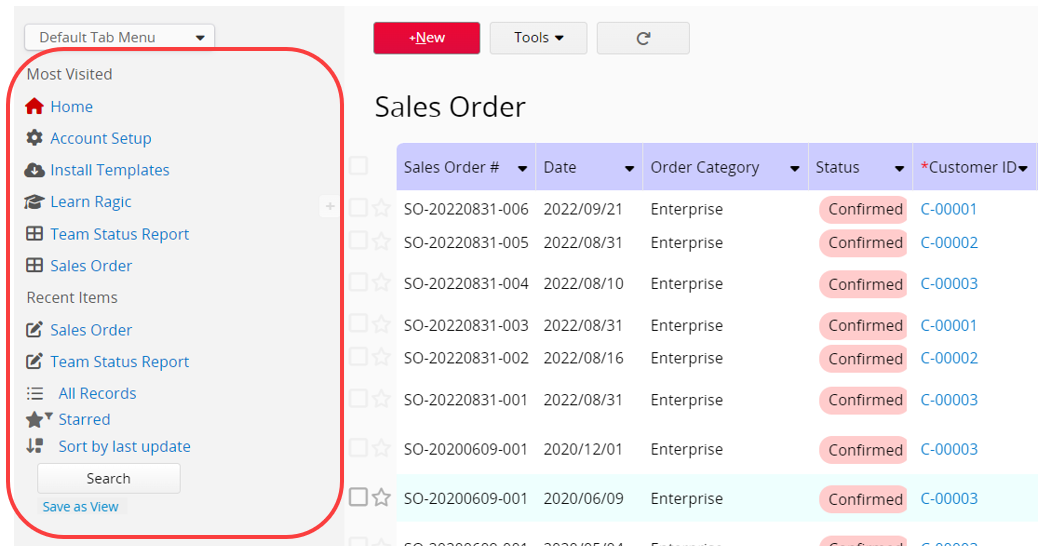
After enabling the Most Visited or Recent Items feature, users can decide whether to display it in their Preferences settings.
 Thank you for your valuable feedback!
