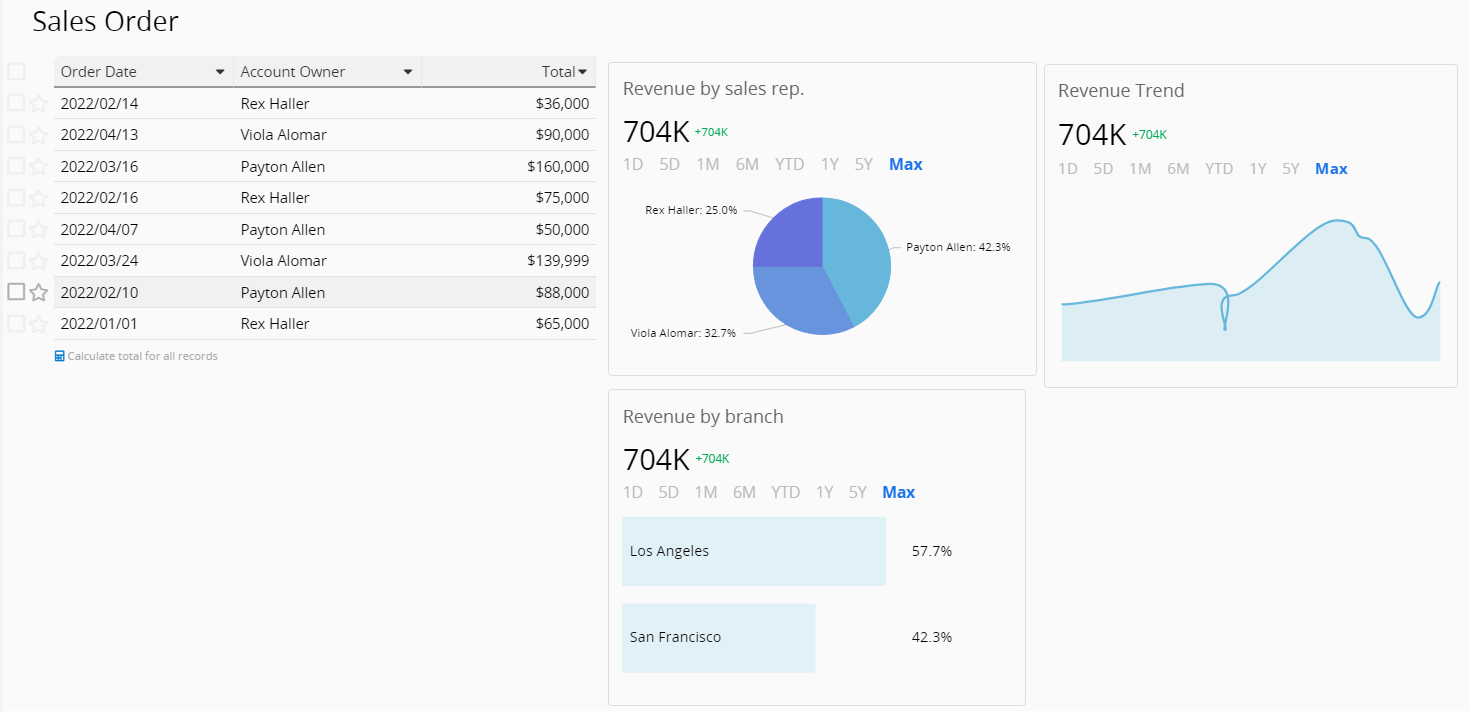
You can insert widgets directly on your sheets for data visualization. For example, displaying a pie chart next to "Sales Order" records showing revenue by sales representative, a line chart depicting revenue growth trends, or branch revenue proportions.
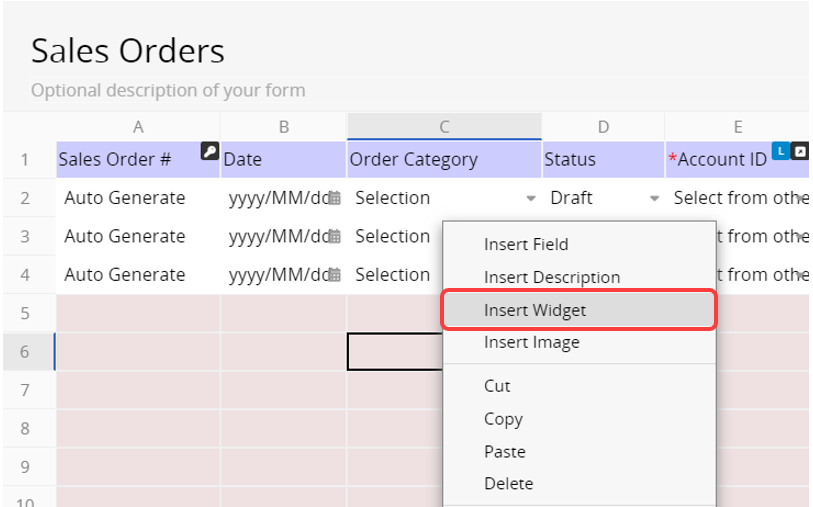
Enter Design Mode on the Form Page or Listing Page, right-click anywhere, and select Insert Widget.
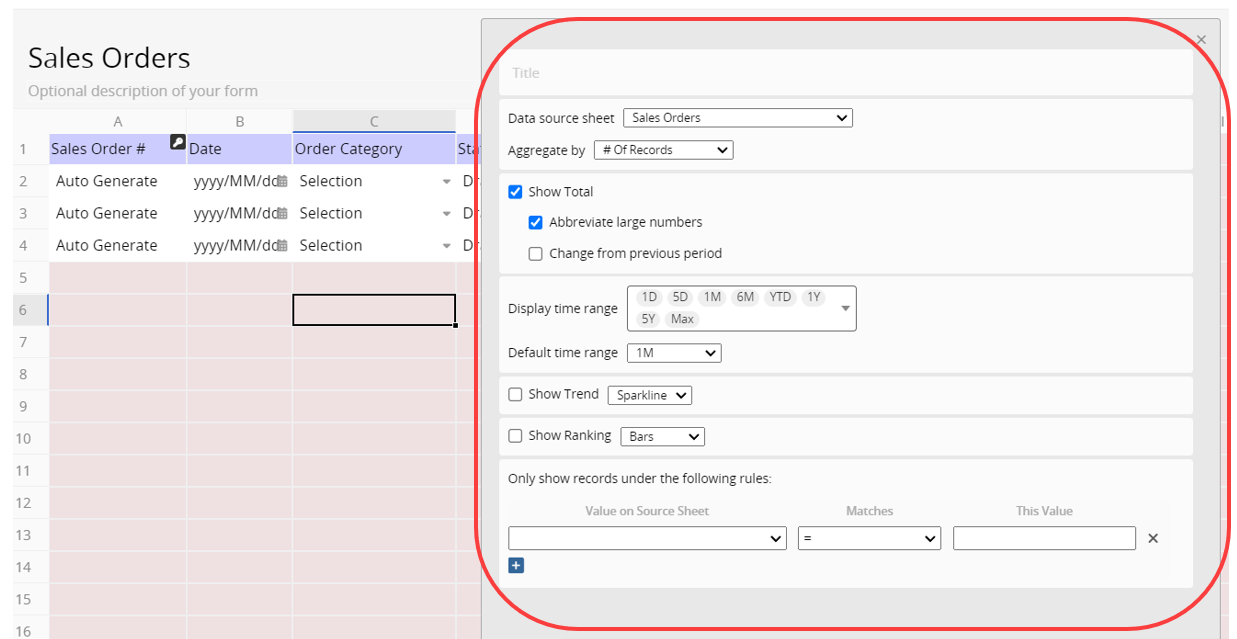
In the pop-up window, you can name the widget, select the source sheet, and configure the types of graphs you want to display:
1. Showing total values
2. Showing trends: Sparkline, Bars, 3D bars
3. Showing rankings: Bars, Pie, Tree map, Radar (Currently, rankings display only the top five categories of data, with an option to show totals for each category.)
You can also set the time range for display or filter records based on specific criteria, such as analyzing only "Sales Orders" with the status "Completed".
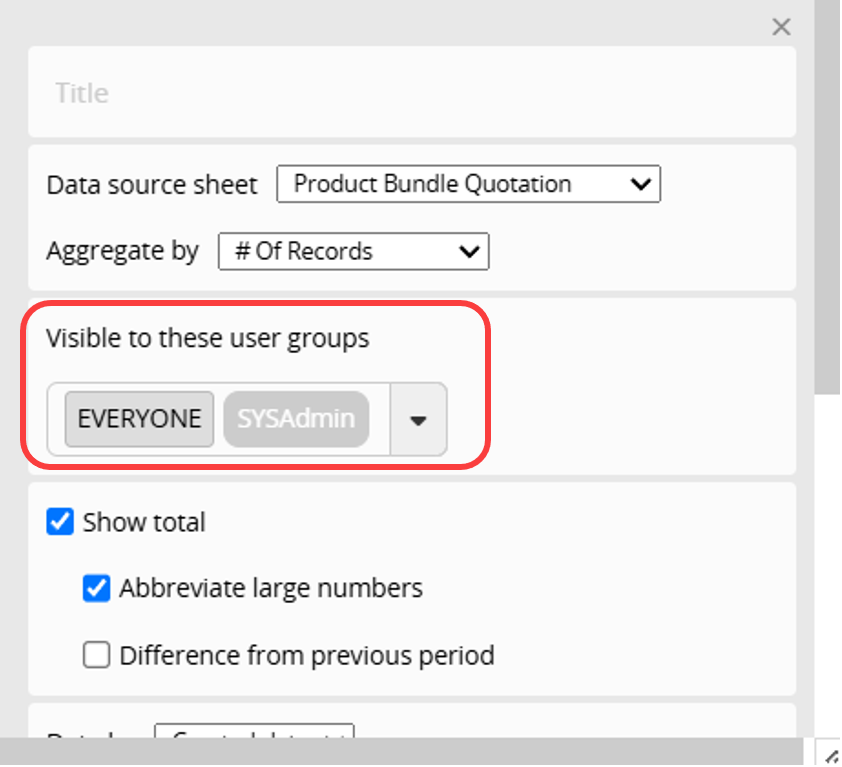
Additionally, you can set Visible to these user groups to specify which user groups can view this widget.
Besides, you can drag and drop the widget anywhere on the sheet, and you can insert multiple widgets in a sheet.
Please refer to the chart below for the filtering mechanisms of widgets in different locations.
| Widget Location | Filtering Situation |
|---|---|
| Homepage Widget | Filtering priority: Fixed filters > Filter conditions set within the widget. All of these will affect the displayed data. |
| Listing Page Widget | Filtering priority: Fixed filters > Custom views and shared views > Filter conditions set within the widget. All of these will affect the displayed data. |
| Form Page Widget | Filtering priority: Fixed filters > Filter conditions set within the widget. All of these will affect the displayed data. |
 Thank you for your valuable feedback!
