When you want to check the ranking of records, you can use the Ranking Report in Ragic Reports. Additionally, you can compare differences over time and generate Pie Charts. For example, you can track product sales rankings, sales performance rankings, or compare event budgets, etc.
Note: The Ranking Report may not be suitable if there are too many items to compare or if the differences between items are very small. In such cases, the ranking results may show minimal differences, and generating a Pie Chart could result in too many segments, making analysis difficult.
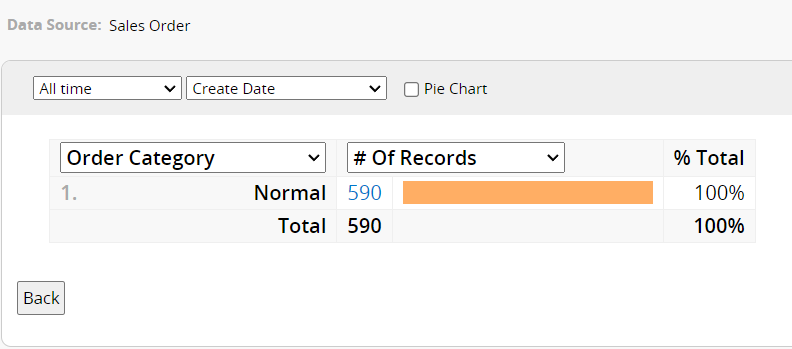
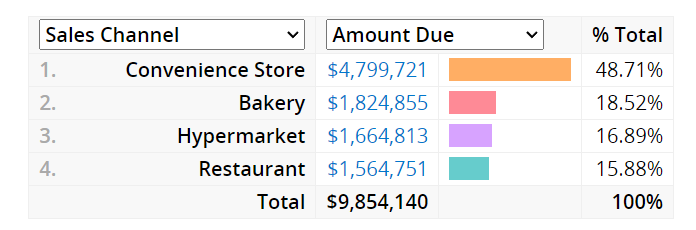
After creating the Ranking Report, the following page will appear.
The settings for the Ranking Report are explained below:
In this section, choose the fields and data you want to rank.
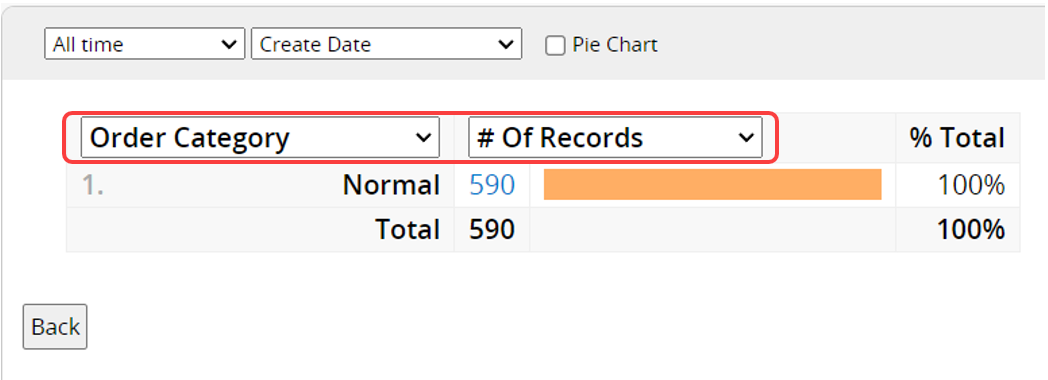
For Ranking Fields, all fields can be selected except those in Subtables.
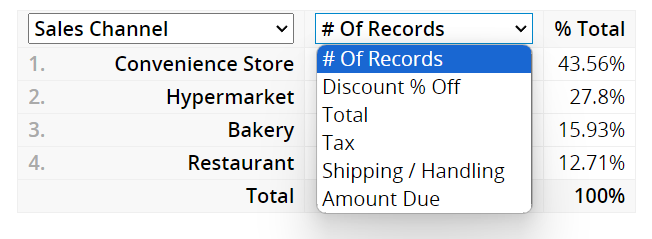
For Ranking Data, you can only choose from "# of Records" or fields with the type Numeric, Percentage, or Money.
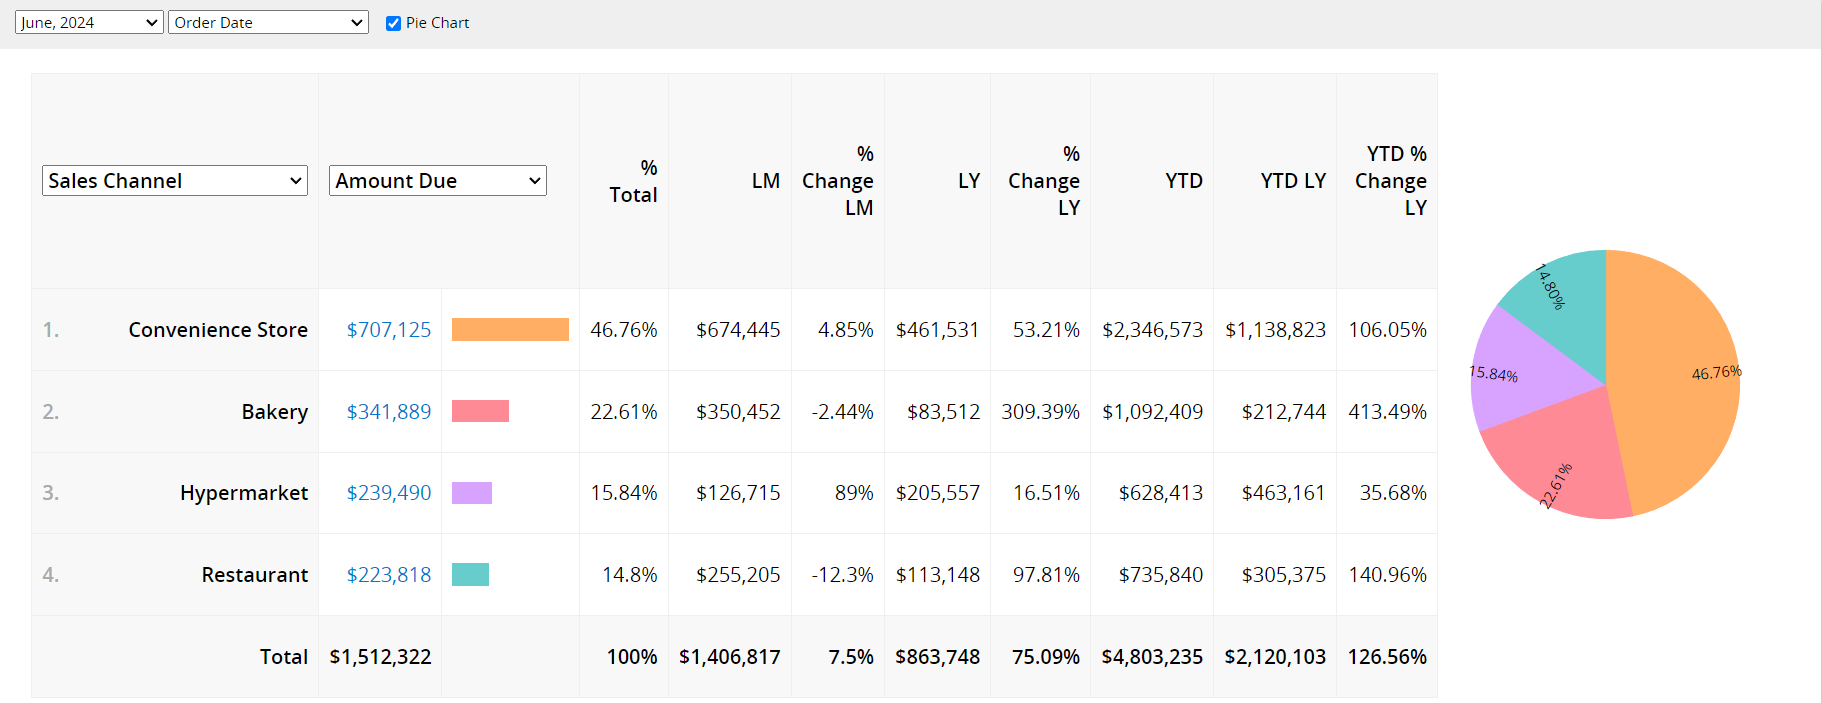
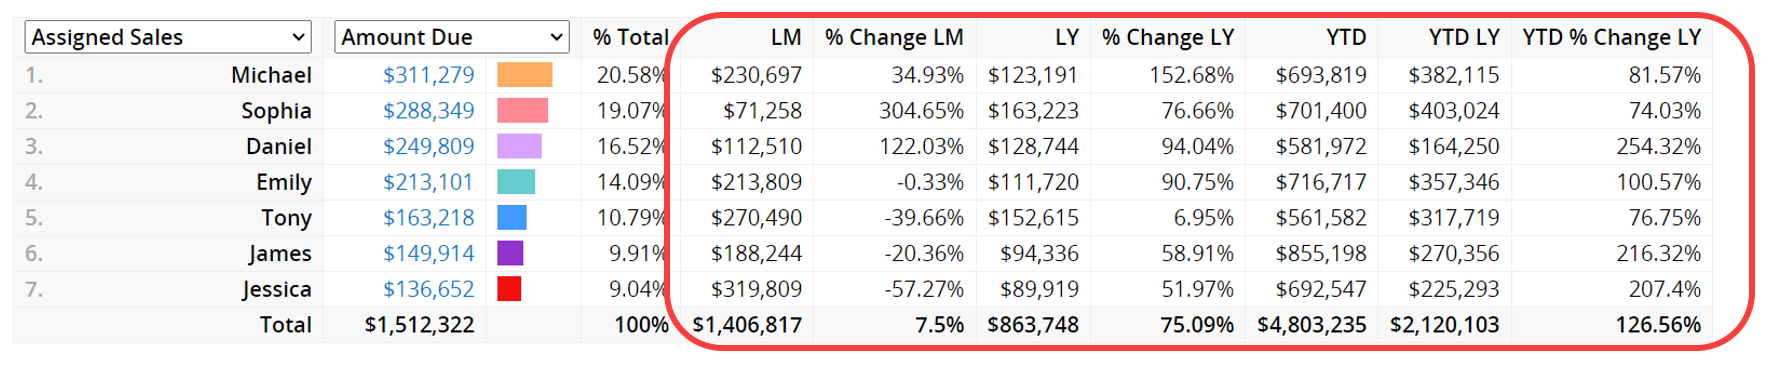
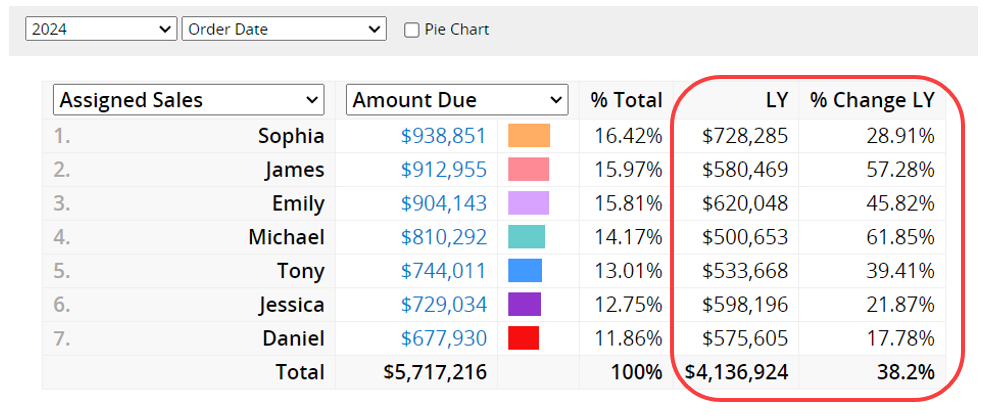
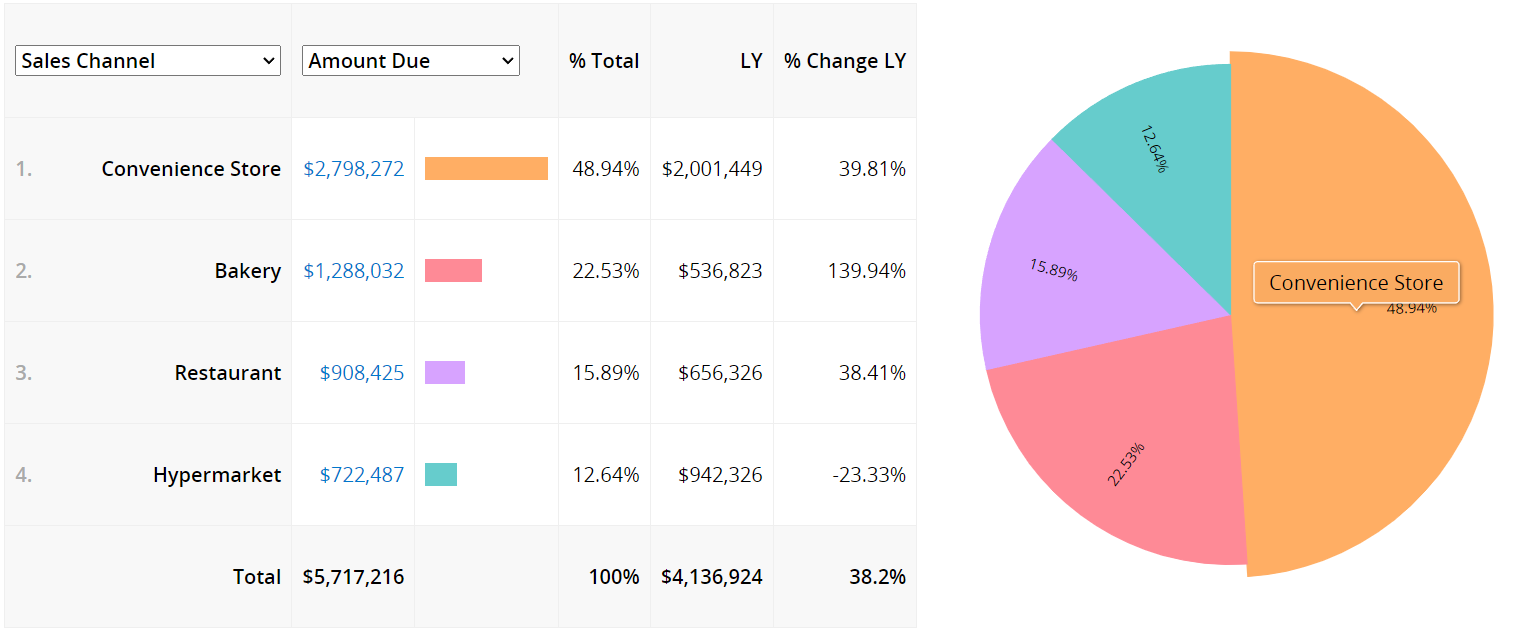
The Ranking Report will be generated based on selected fields. It will display the total values for the chosen Ranking Fields, as well as bar charts and percentage shares of the total.
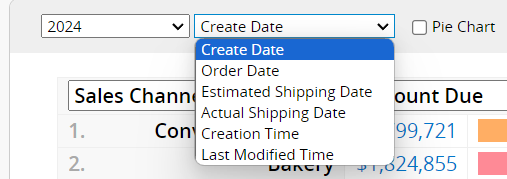
In the top section, select the Timeframe for Ranking and the Source Field for Timeframe.
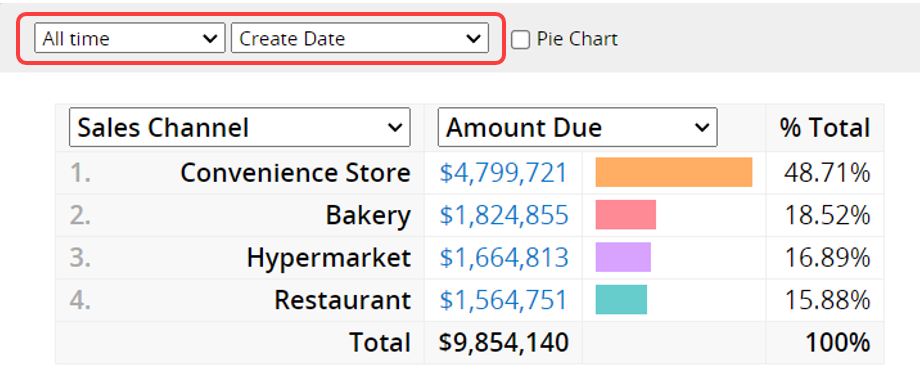
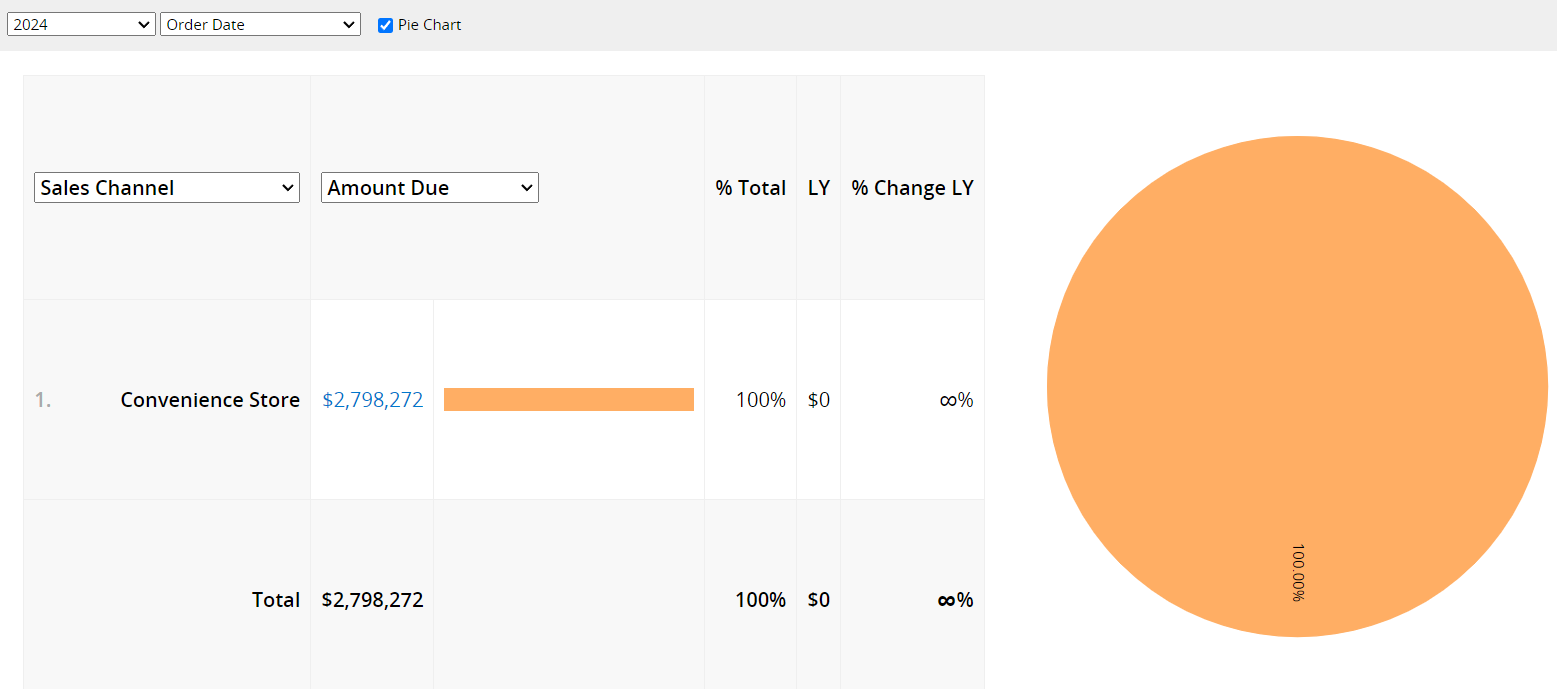
Timeframe for Ranking: Choose by month, by year, or select all time.
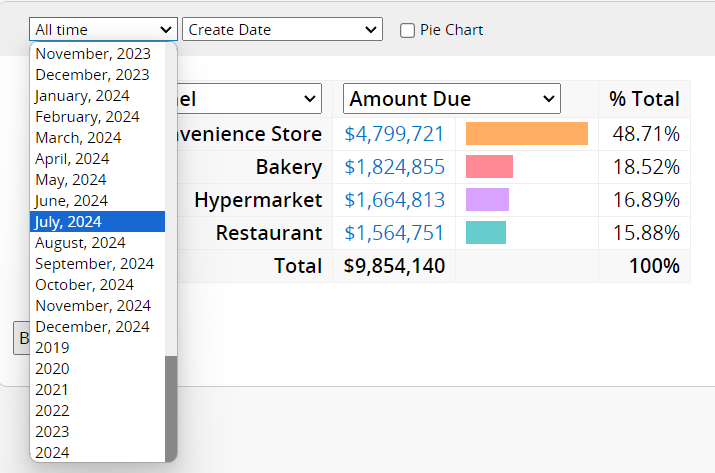
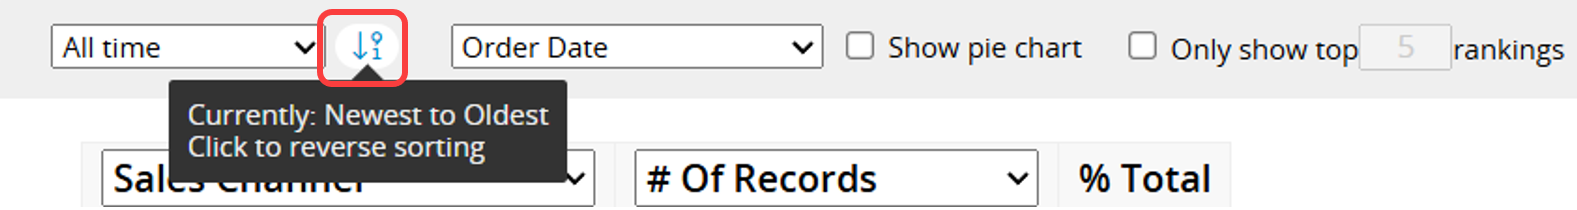
Note: You can adjust the sort order for the "Timeframe for Ranking" field.
Source Field for Timeframe: Select the Date field in the sheet to filter the data.
If you select a specific time, such as orders from "June 2024", the report will also display data from the previous month and the same month from the previous year, along with a comparison of the differences.
If you select a "year", the report will only display data from the previous year and a comparison.
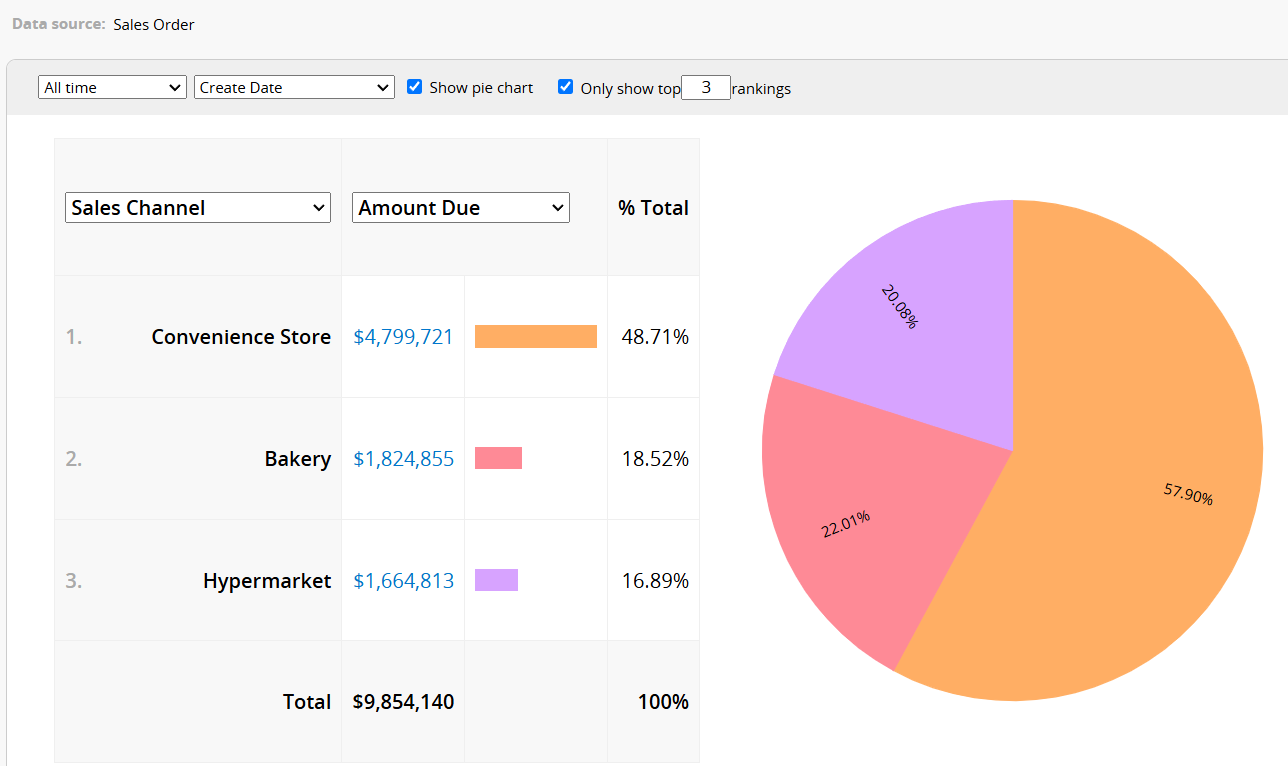
Check the Show pie chart option at the top to display a Pie Chart on the right side of the report. Hover over a section of the chart to see the item name for that segment.
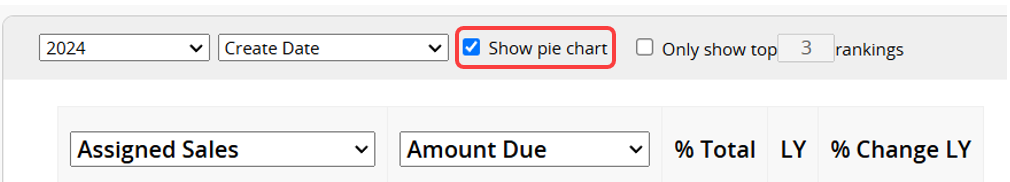
When there are too many items, making analysis difficult, you can select the Only show top rankings option at the top and enter a number. For example, if you enter "3", the report will display only the top 3 results.
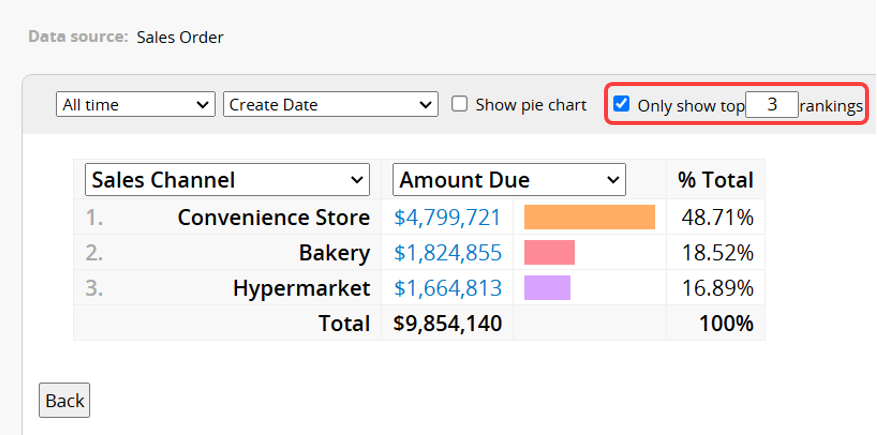
If the Show pie chart option is also selected, it will likewise display only the top 3 results.
Click on a "data" or a "section of the Pie Chart " to navigate directly to the sheet's Listing Page. The records will be filtered to match the selected criteria and time. For example, if you select data for convenience stores in the report, it will automatically filter to show only convenience store records.
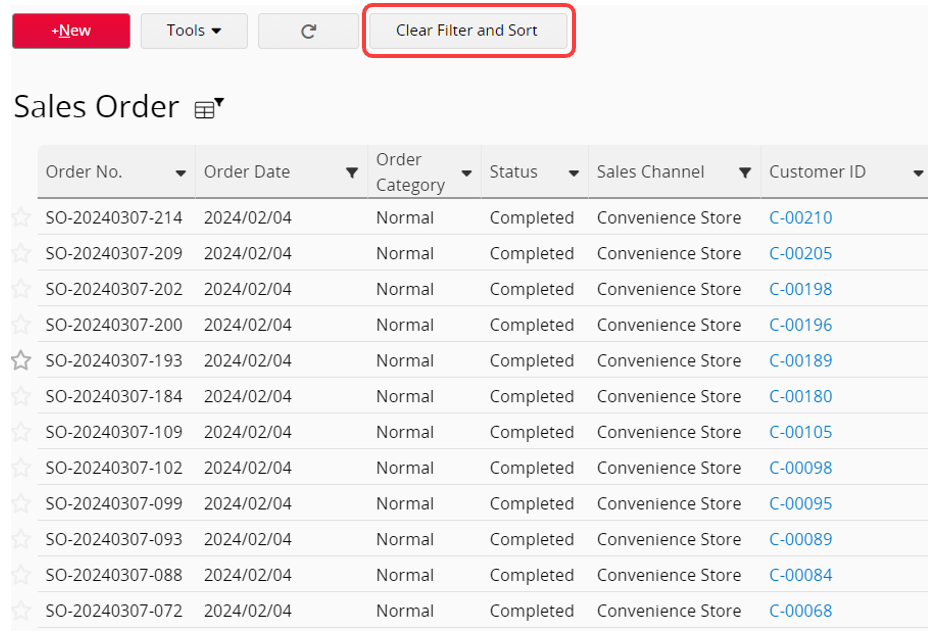
Note: The sheet will display only the filtered records, so returning to the ranking report will show only the records you have filtered.
To return the report to view all records, first click Clear Filter and Sort on the sheet's Listing Page, and then return to the report.
If you frequently use this type of report, you can save it for easy access later. Additionally, you can export the report as a PDF file or print it.
You can apply filters to generate the desired report.
You can embed the report into your website or share a link with others.
In the Report Settings, you can adjust the report’s style settings, including font, font size, borders, etc., and the report’s Filter and Access Rights.
You can generate an editable Report Snapshot to highlight data, apply styles to report content (for example, bold, underline, or font color), add explanatory text, or remove unnecessary data without using filters.
 Thank you for your valuable feedback!
