Pivot Table can be used to categorize, summarize, and analyze large amounts of records, helping you compile and interpret sheet data saved in your sheet. For example, it can analyze sales revenue by different channels or quarters, compare branch performance across regions, or conduct financial analysis of various company revenues by quarter, etc.
You can create reports by selecting different "Column" and "Row" fields from the sheet. The report will calculate the "total" or "average" based on your settings and generate the Pie Chart.
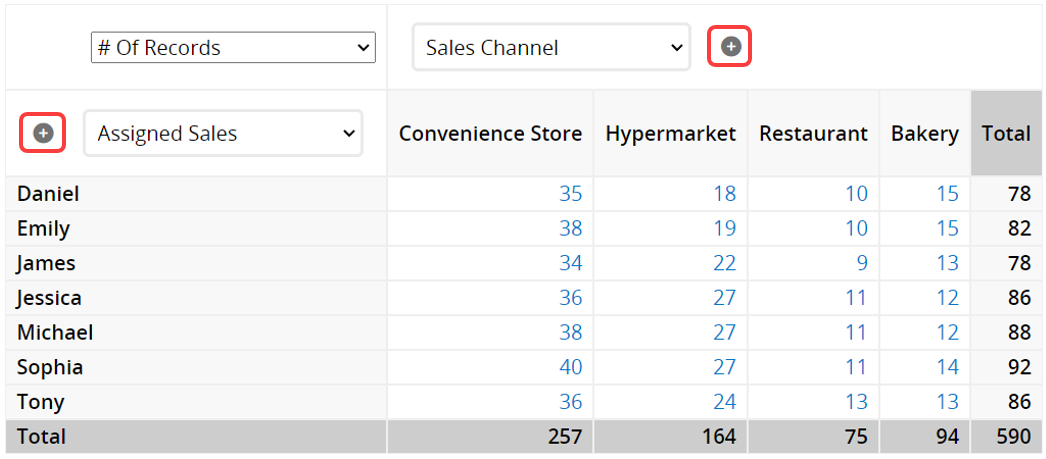
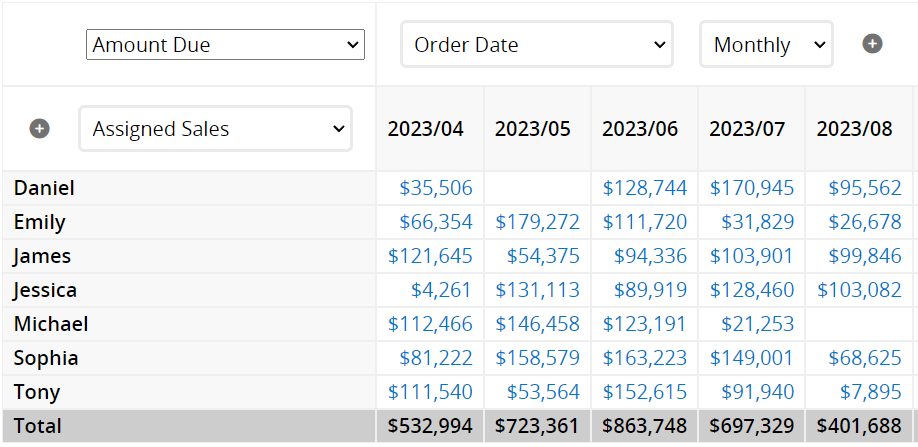
After creating the Pivot Table, the following page will appear.
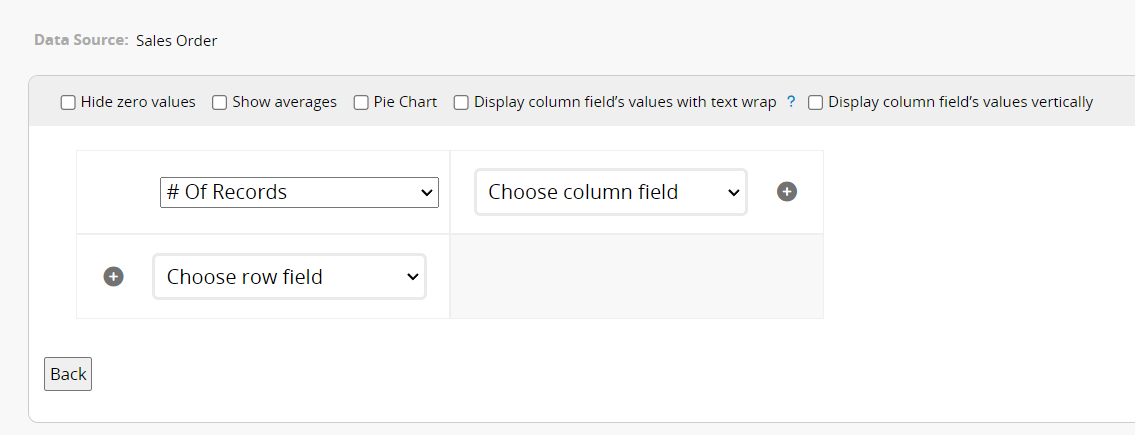
The settings for the Pivot Table are explained below:
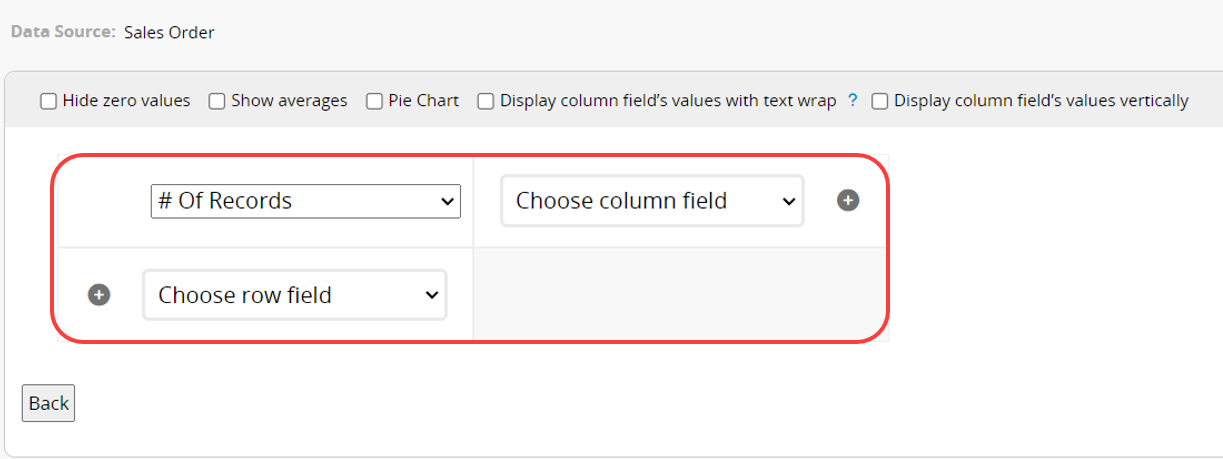
Select the fields you want to analyze: Target Field, Column Field, and Row Field.
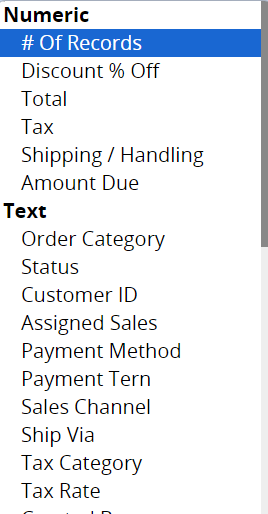
Target Field: You can choose to analyze the # of Records, numerical values, amounts, or any other field in the sheet as the target for analysis.
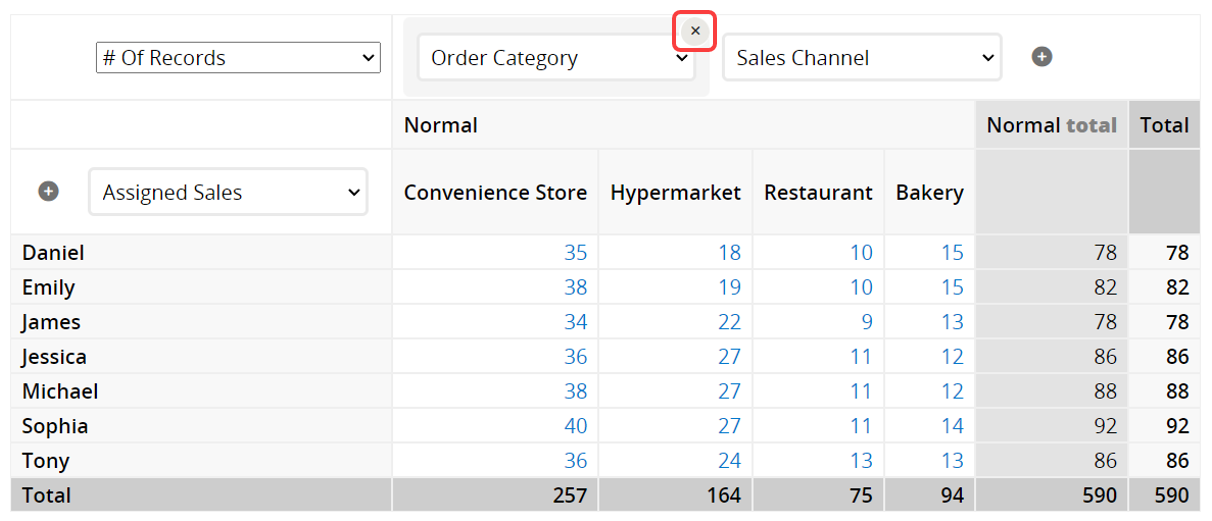
Column Field and Row Field: You can analyze multiple sets. Click the "+" next to a field to add more Column and Row fields.
If you want to remove a field, hover over the top right corner of the field and click the "x" to remove it.
Additionally, the order of the fields affects the analysis results. You can change the order by dragging the fields. As shown in the video below, altering the left-to-right order of fields will change the sequence of data analysis.
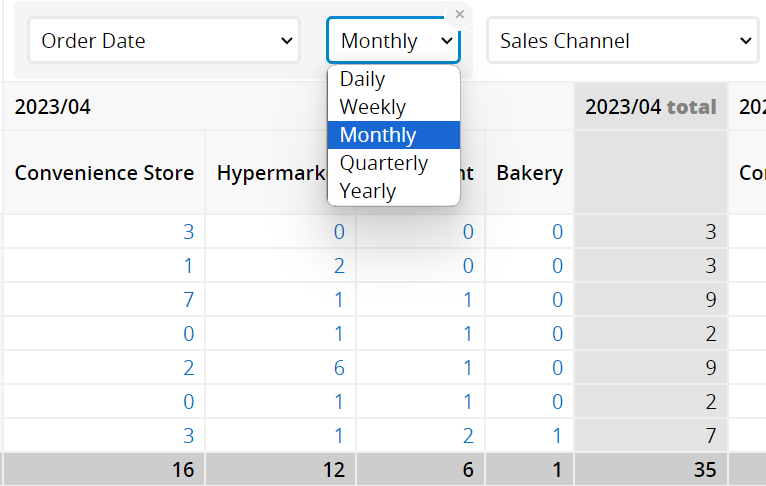
If a Date field is selected, you can also choose the interval for the analysis.
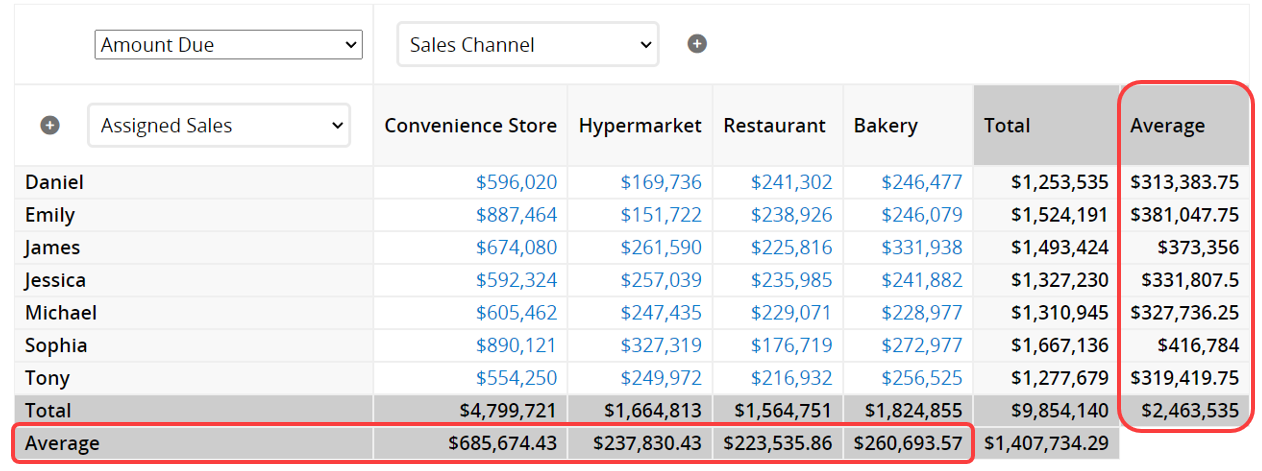
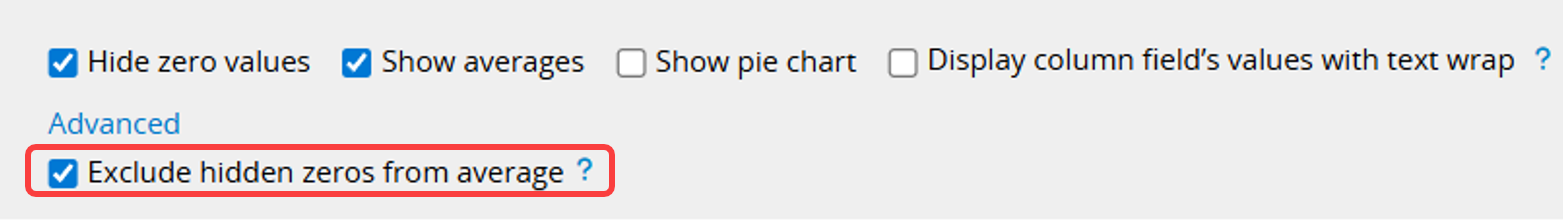
At the top of the report, you can configure how values are displayed. You can choose to Hide zero values or Show averages.
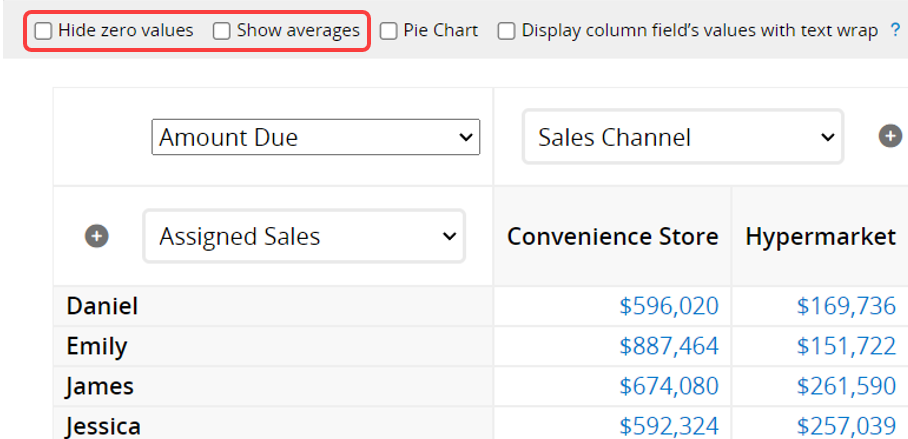
"Hide zero values": Check this option to hide any values that are "0" in the report.
"Show averages": Check this option to display the "average value"s for the Column and Row fields.
When "Hide zero values" and "Show averages" are both checked, you can also select "Exclude hidden zeros from average" in Advanced settings. When checked, the average will include only the numbers visible on the screen, and hidden zero values will not be counted in the average.
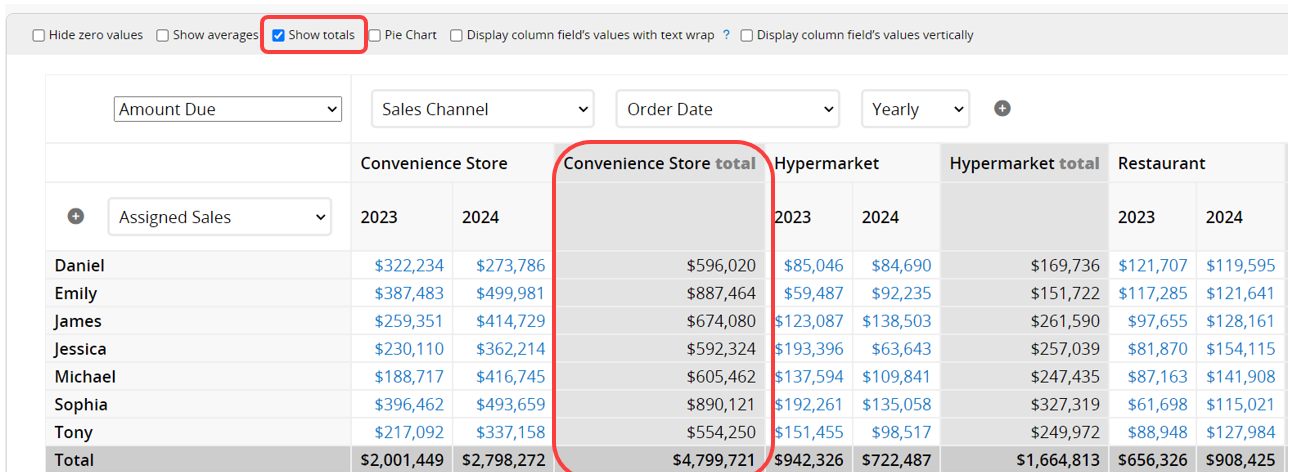
When multiple "Column fields" are set, an additional Show totals checkbox will appear. Selecting this option will display the total values for the second Column field. For example, if you analyze data by "Sales Channel" and "Order Date", and "Sales Channel" is the second Column field, the report will also show total values for each channel.
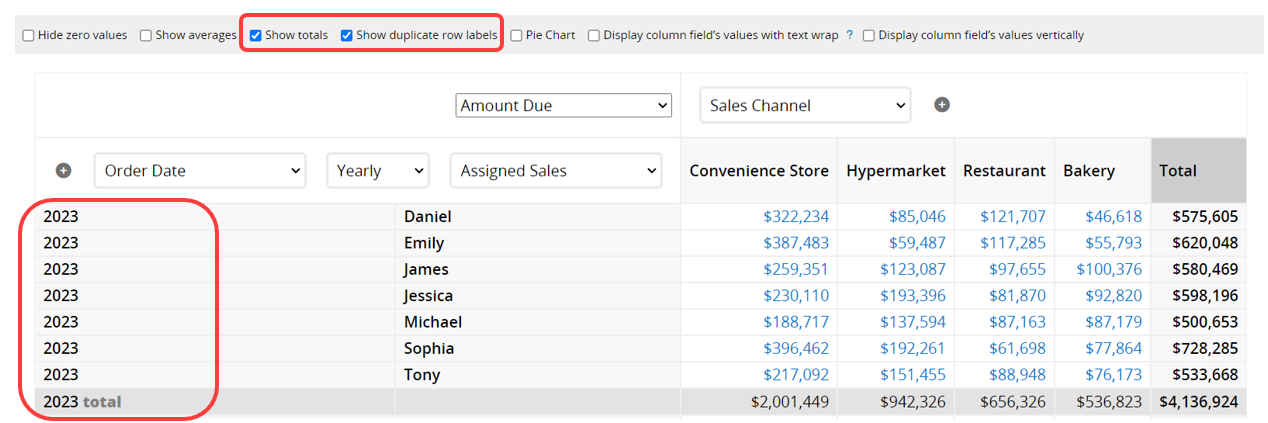
When multiple "Row fields" are set, the top section will include both the Show totals checkbox and an additional Show duplicate row labels checkbox.
In the example below, total values for the second Row field, "Order Date", are shown, and row labels for the same year are repeated.
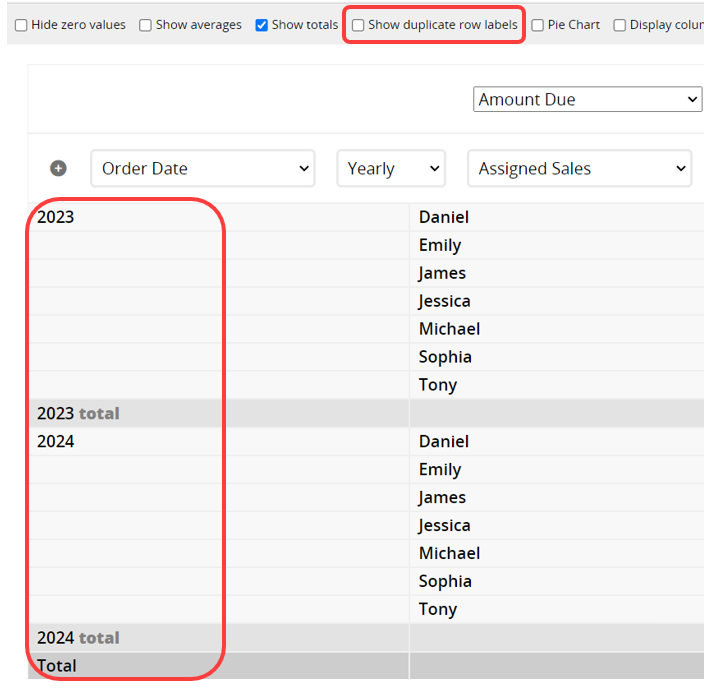
If you uncheck Show duplicate row labels, the items will no longer be displayed multiple times, as shown in the image below.
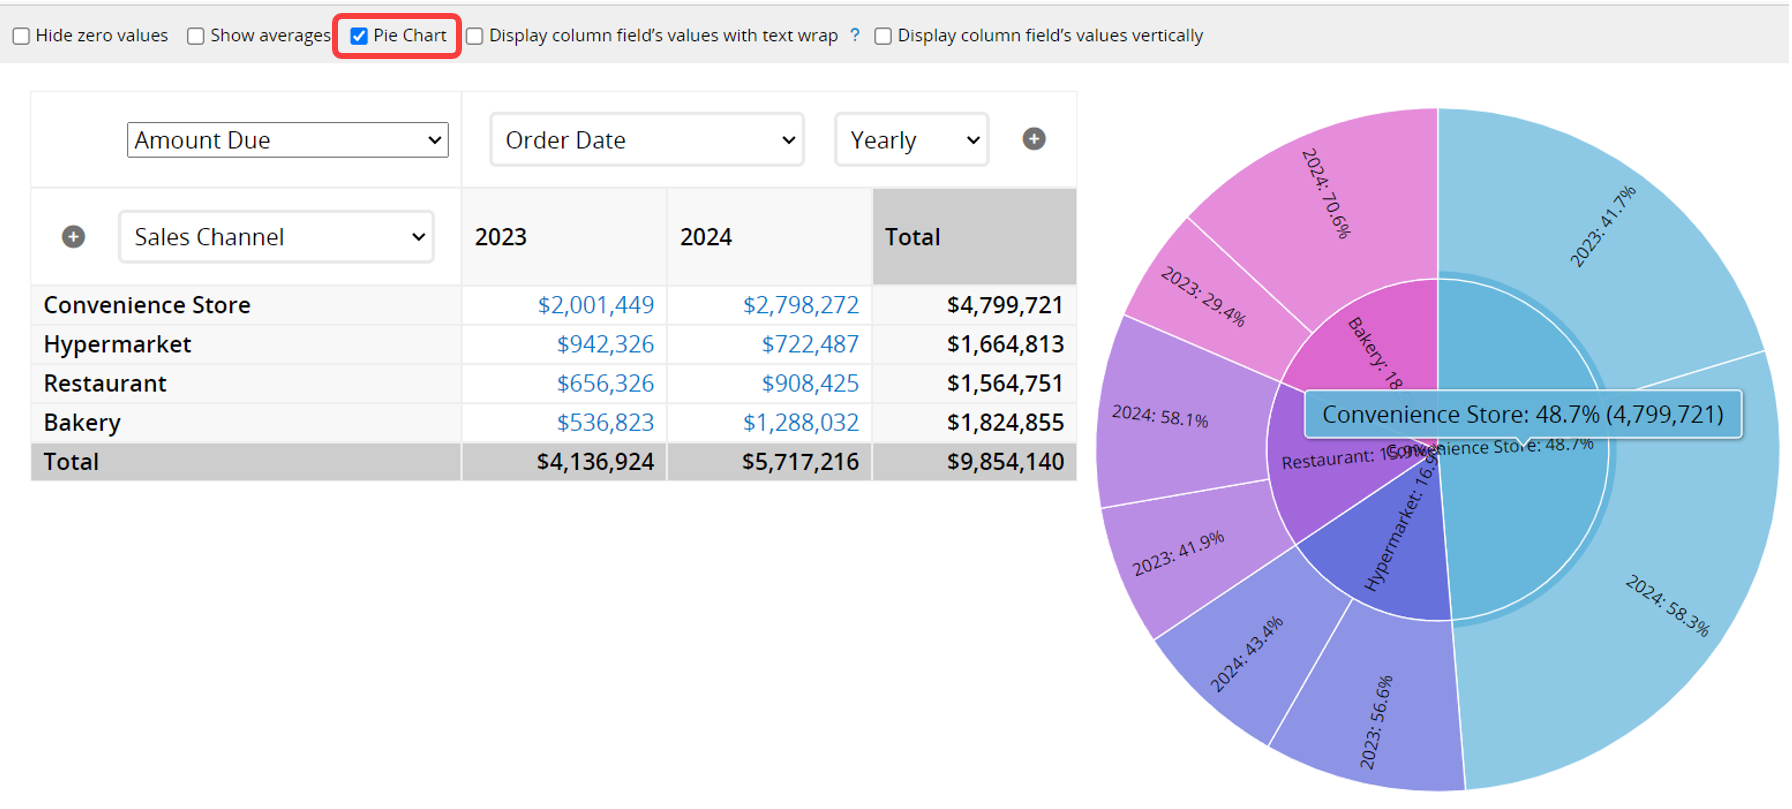
Check the Pie Chart option at the top to display a Pie Chart on the right side of the report. Hover over a section of the chart to see the item name for that segment.
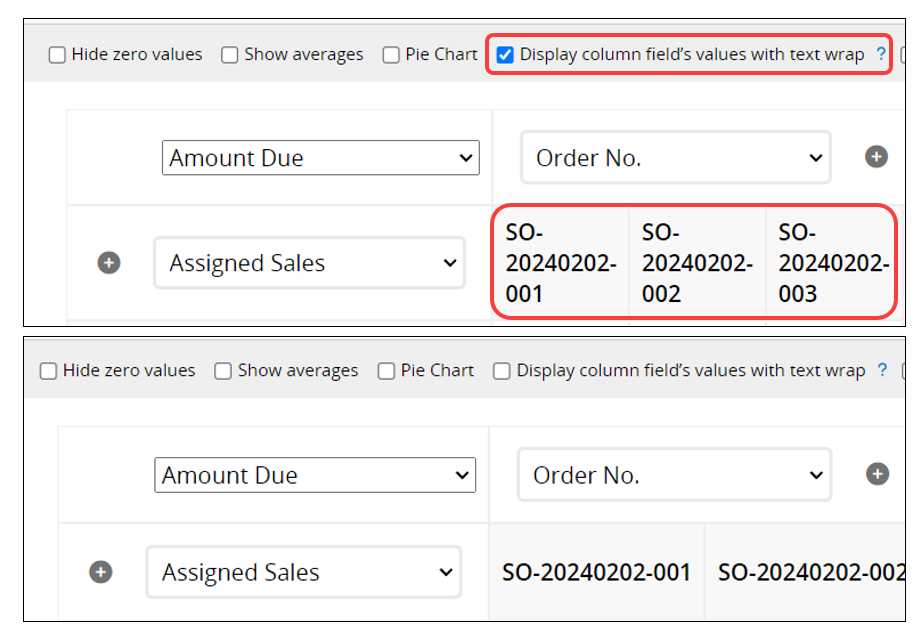
You can adjust the display settings for Column field items.
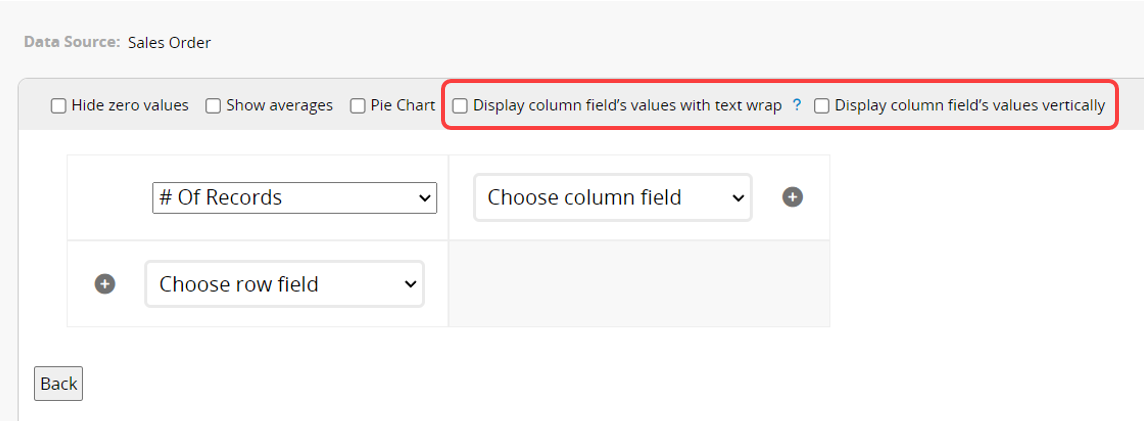
Display column field’s values with text wrap: Check this option to wrap the text to the next line if an item’s content is too long. If unchecked, the text will be displayed on a single line.
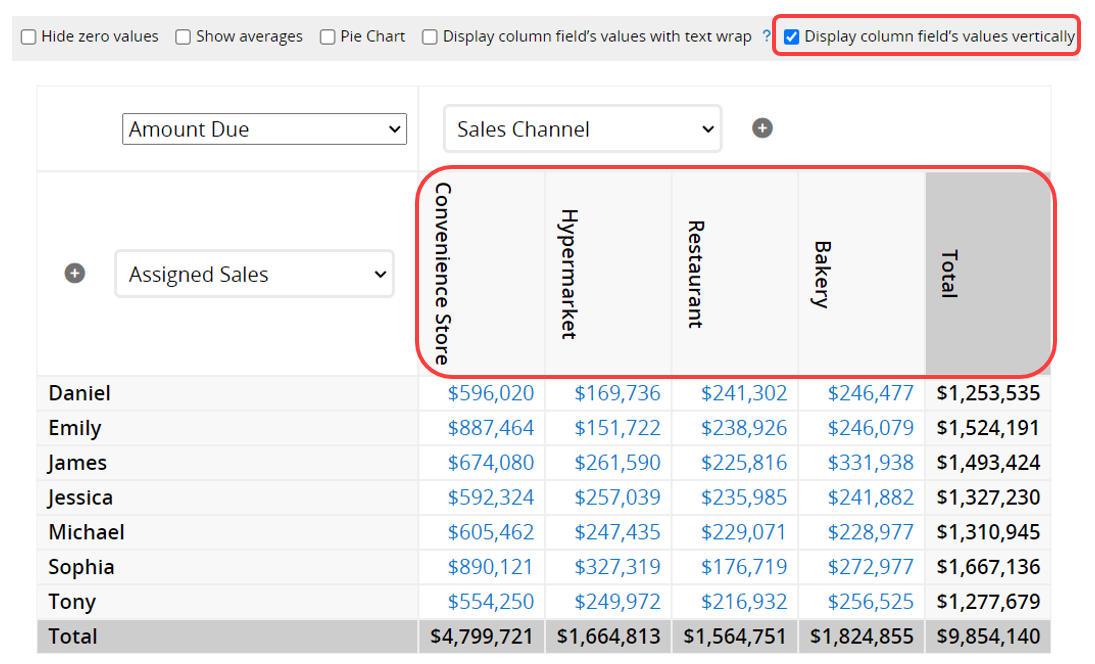
Display column field’s values vertically: Check this option to display the content of the Column field items vertically.
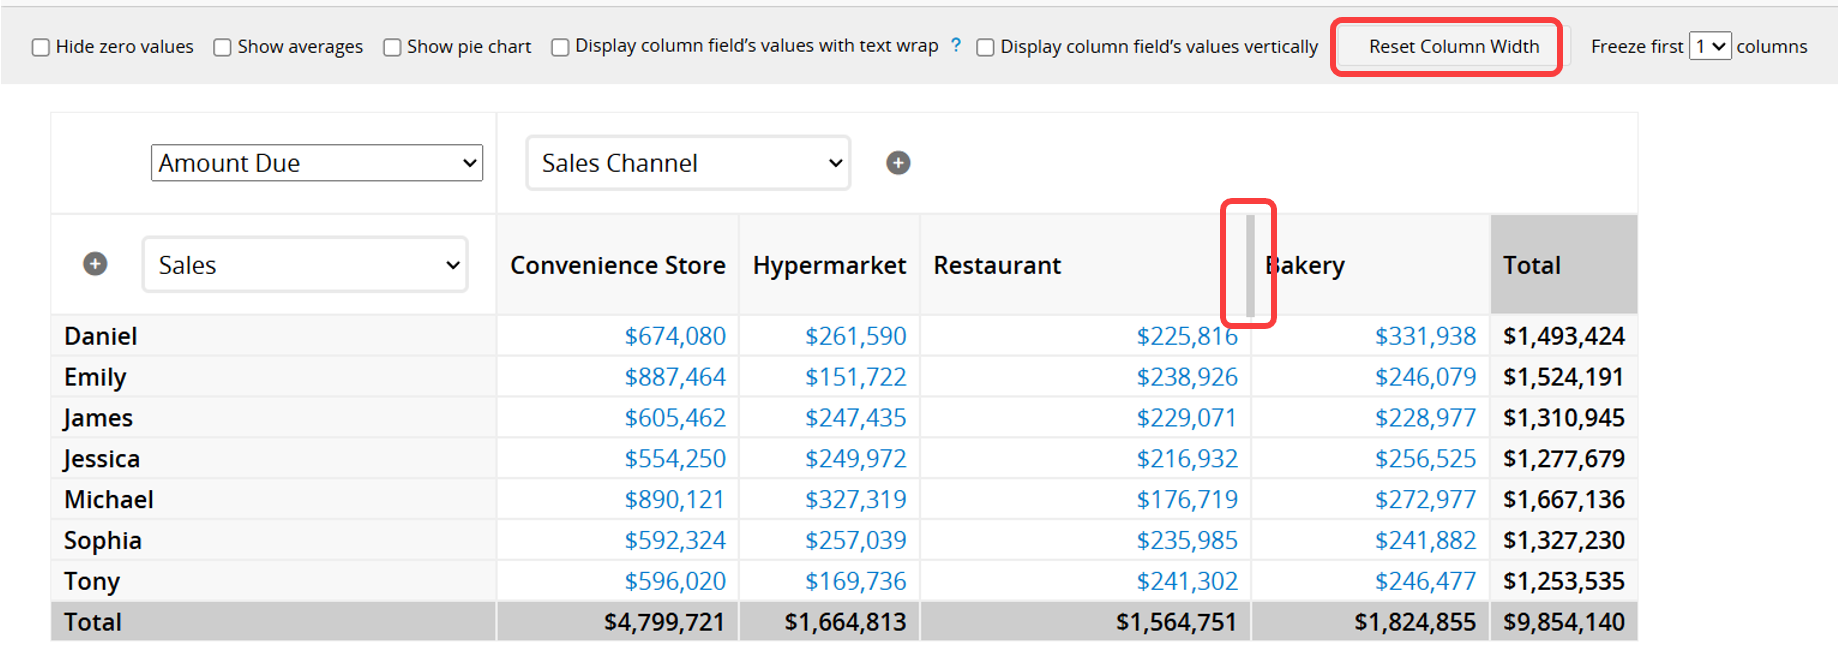
You can drag the field borders to adjust the column width, or click Reset Column Width at the top to restore the default setting.
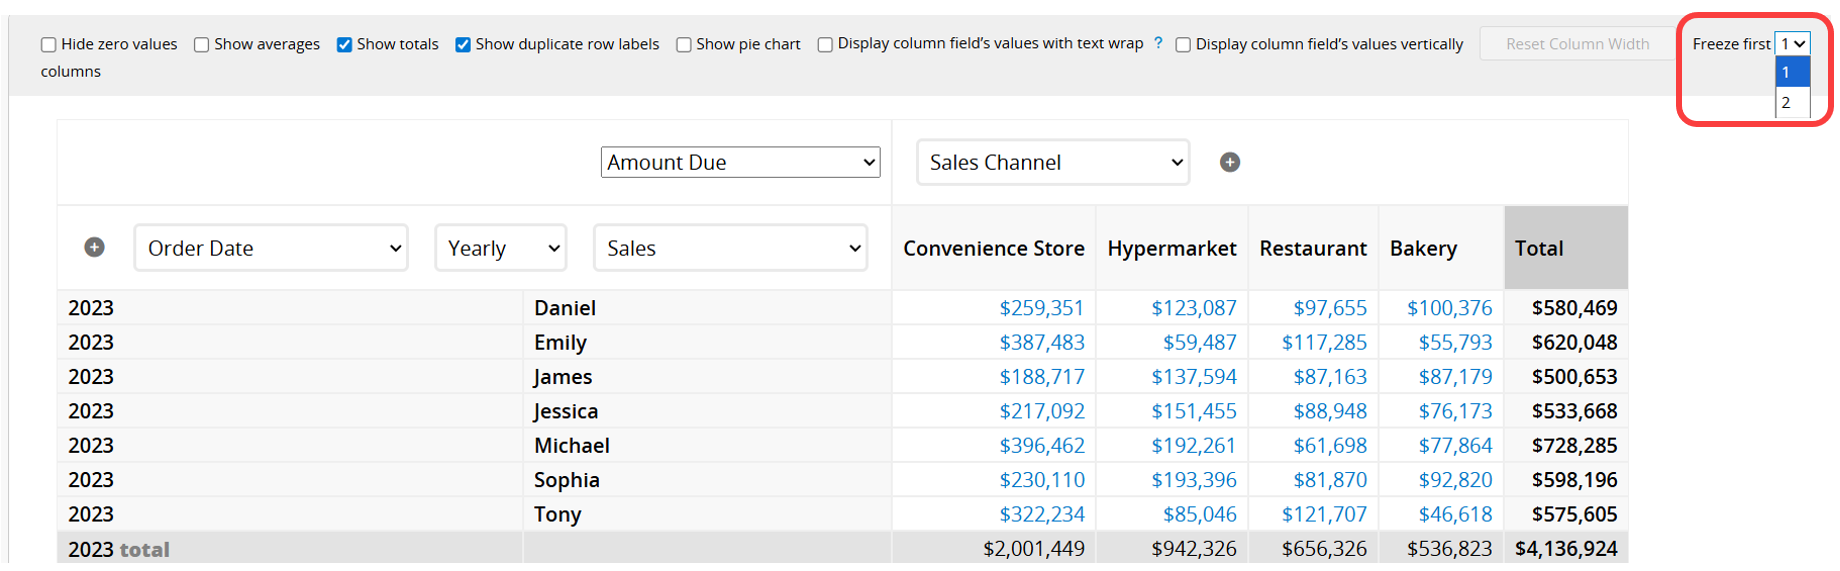
When multiple "Column fields" are set, you can choose how many of the first columns to freeze at the top to make the report easier to view.
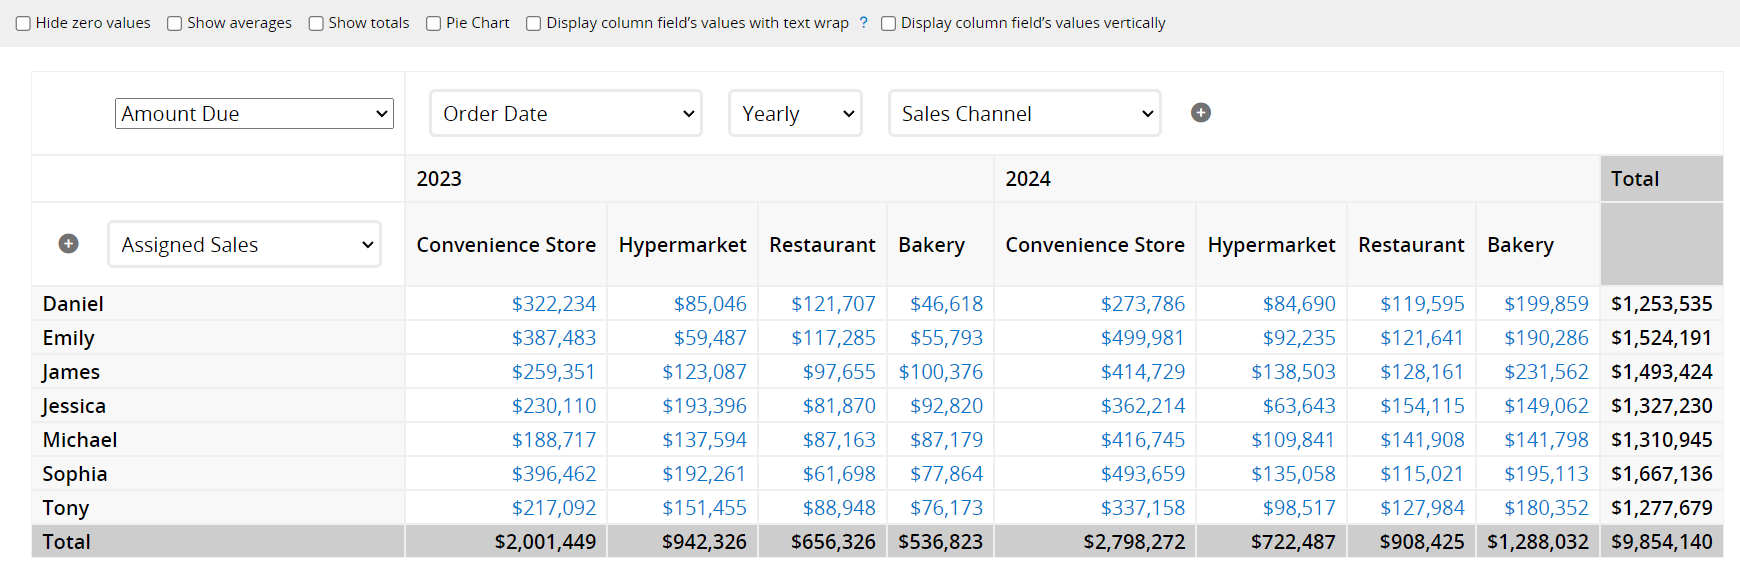
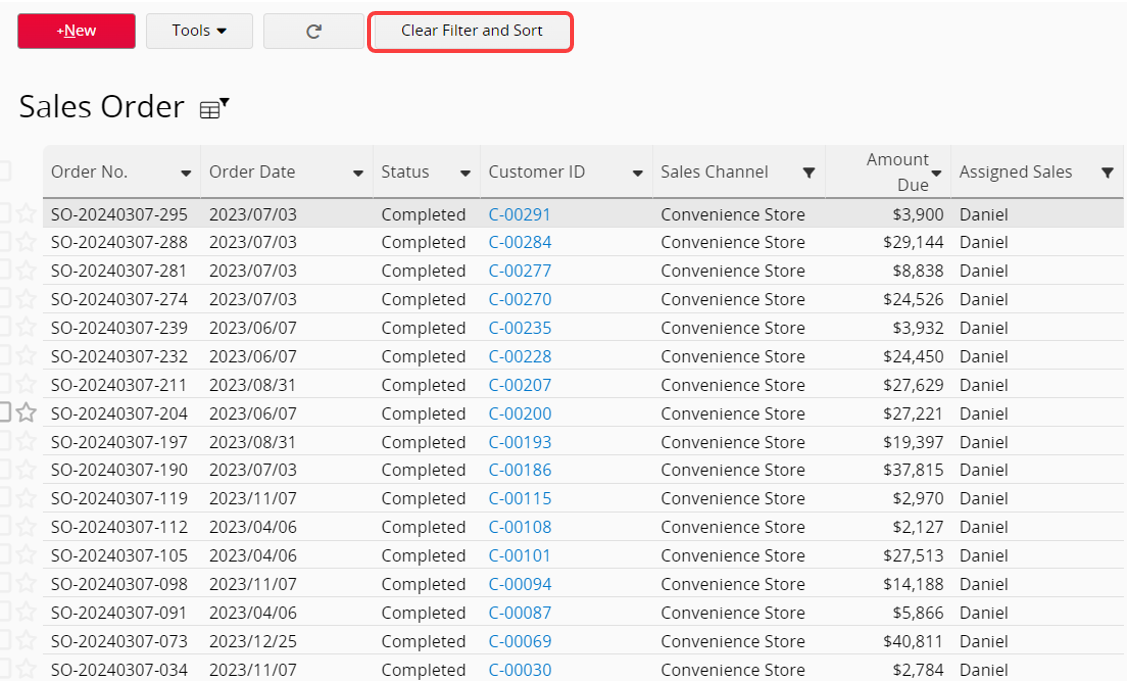
Click on a "Statistics Data" item to navigate directly to the sheet's Listing Page. The records will be filtered to match the selected criteria. For example, if you select to view sales performance data for convenience stores, it will automatically filter to show only records for that salesperson and the convenience store channel.
Note: The sheet will display only the filtered records, so returning to the Pivot Table will show only the records you have filtered.
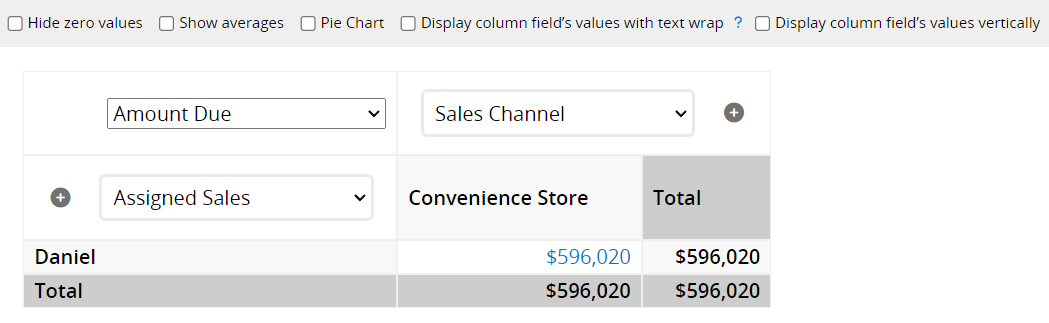
To return the report to view all records, click Clear Filter and Sort on the sheet's Listing Page, and then return to the report.
If the number of rows exceeds 1,000 (in any dimension), the following message will appear.
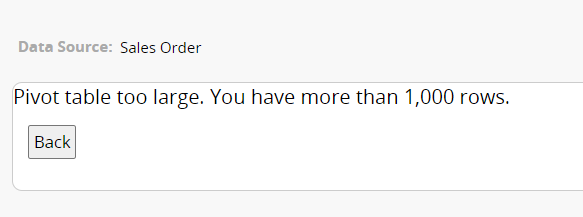
Note: The row limit refers to the final number of rows displayed in the report, not the total number of records. For example, when analyzing "Product Category", data is aggregated by category, so the report may show only a dozen rows, with each row containing all related statistics.
If you frequently use this type of report, you can save it for easy access later. Additionally, you can export the report as a PDF file or print it.
You can apply filters to generate the desired report.
You can embed the report into your website or share a link with others.
In the Report Settings, you can adjust the report’s style settings, including font, font size, borders, etc., and the report’s Filter and Access Rights.
You can generate an editable Report Snapshot to highlight data, apply styles to report content (for example, bold, underline, or font color), add explanatory text, or remove unnecessary data without using filters.
 Thank you for your valuable feedback!
