Ragic offers various reports. You can use them to analyze your data according to your needs. You can also save reports for other users to access directly.
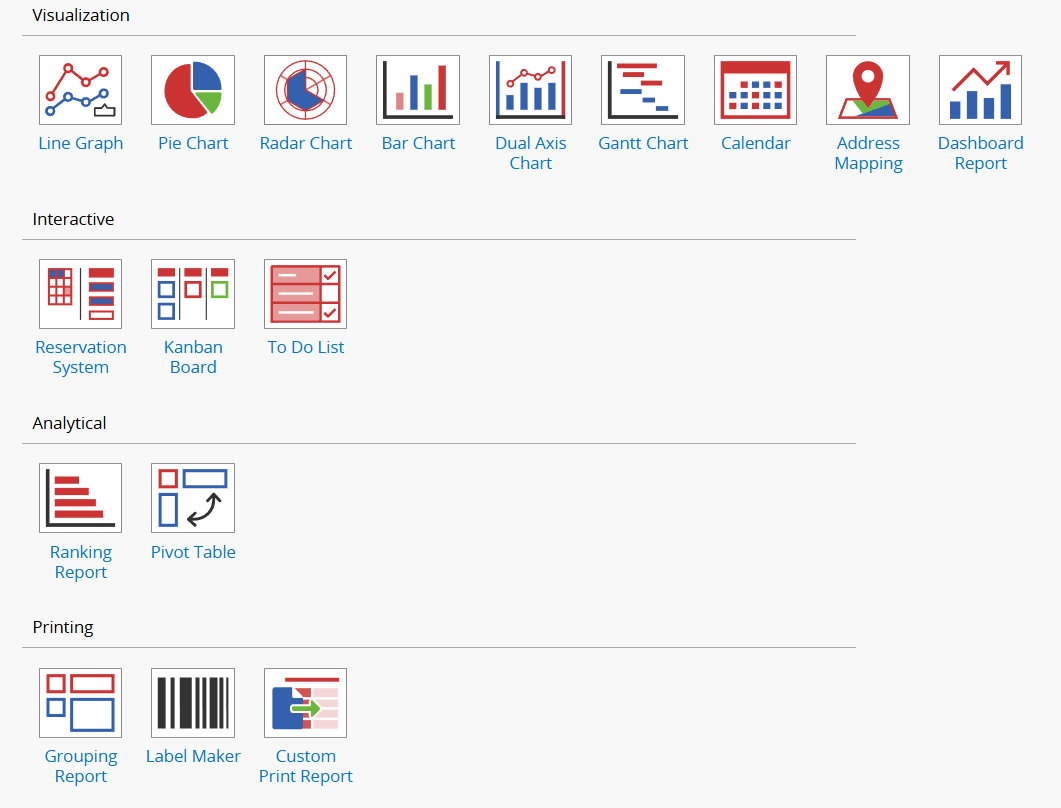
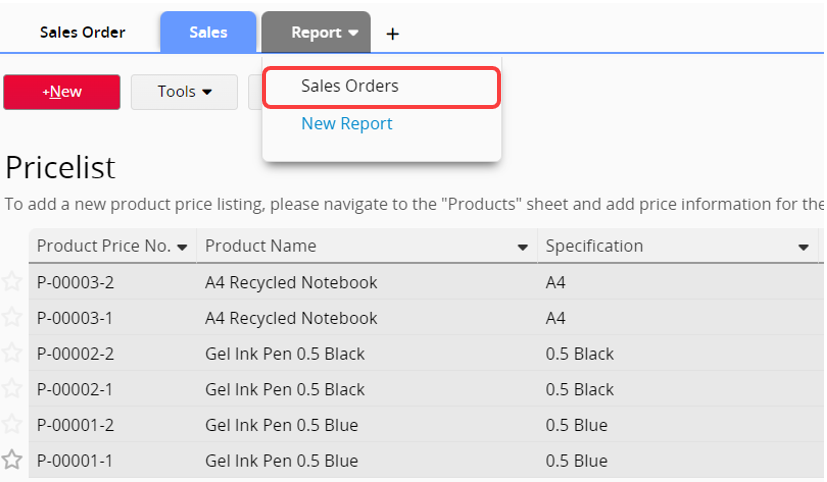
Click on Reports at the top right of the Listing Page to select the type of report you want to generate.
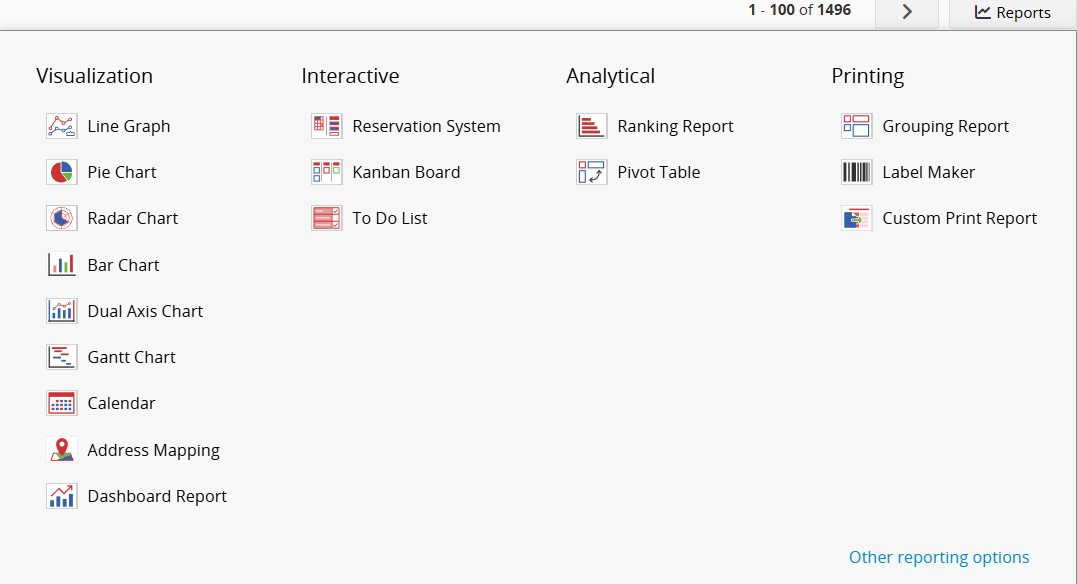
Alternatively, you can create or view saved reports in the Reports tab.
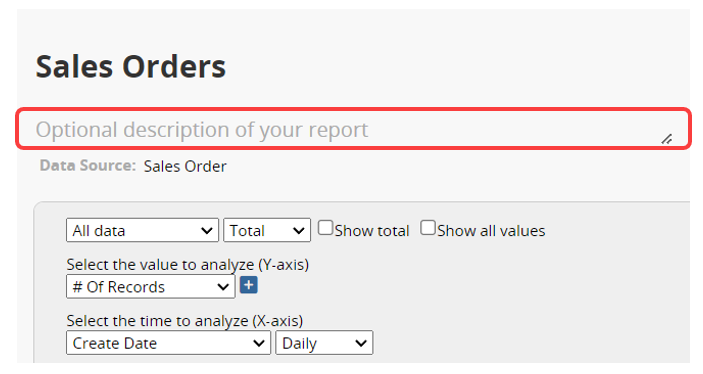
In addition to naming the report, you can also add a description to it.
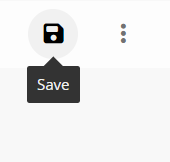
Once you complete setting up a report, click the Save icon at the top right to save it.
After saving, you can find the report in the Reports tab.
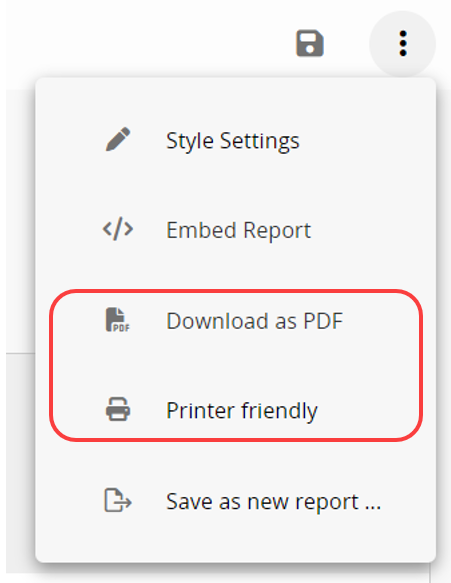
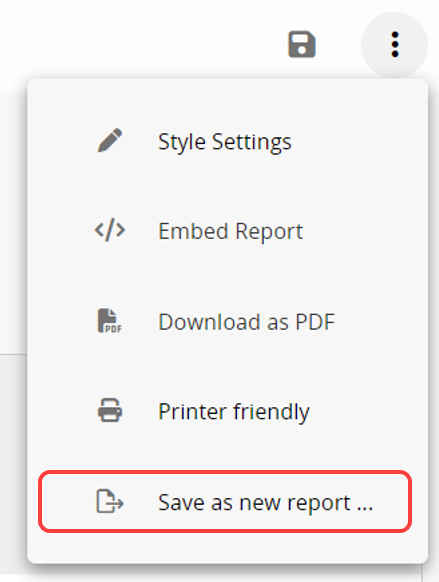
Additionally, you can click ![]() at the top right and select Download as PDF or Printer Friendly to save the report as a PDF file or print it.
at the top right and select Download as PDF or Printer Friendly to save the report as a PDF file or print it.
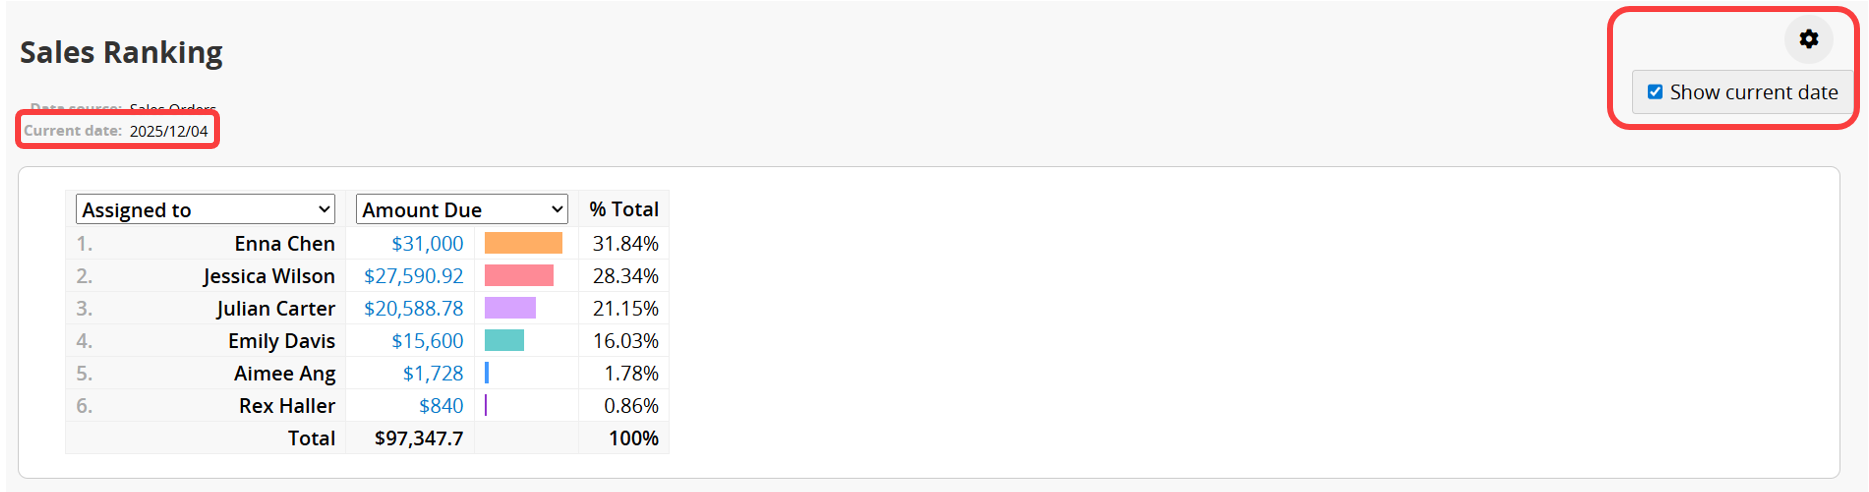
On the Printer Friendly page, click the gear icon in the upper right corner and select "Show current date" to display the date at the top of the report when printing.
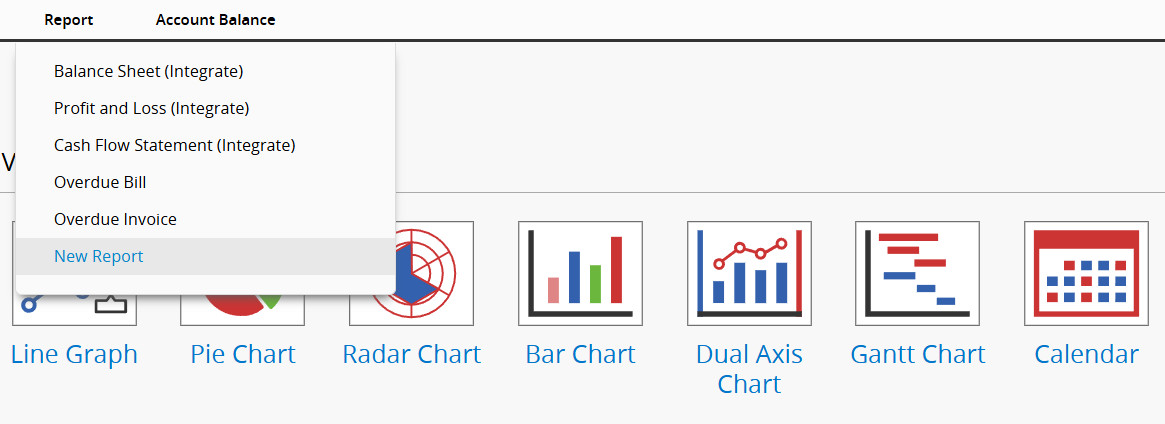
To create a new report based on an existing one, choose Save as new report.
Currently, the report provides the following three filters:
In Report Settings > Basic, you can set preset filters that allow users to apply filters to these fields before using the report. Please refer here.
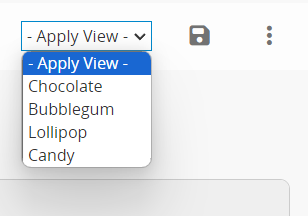
When a sheet has Shared Views applied, you can select the desired filter from the top right corner to display results based on different filtered criteria.
Additionally, if a sheet has the Fixed Filter applied, the report will only show the filtered results.
At the top of the report, you can add filter fields to apply filters. In addition to independent fields, Subtable fields can also be used as filter criteria. Please note that these filter settings cannot be saved and are only for temporary use while viewing the report.
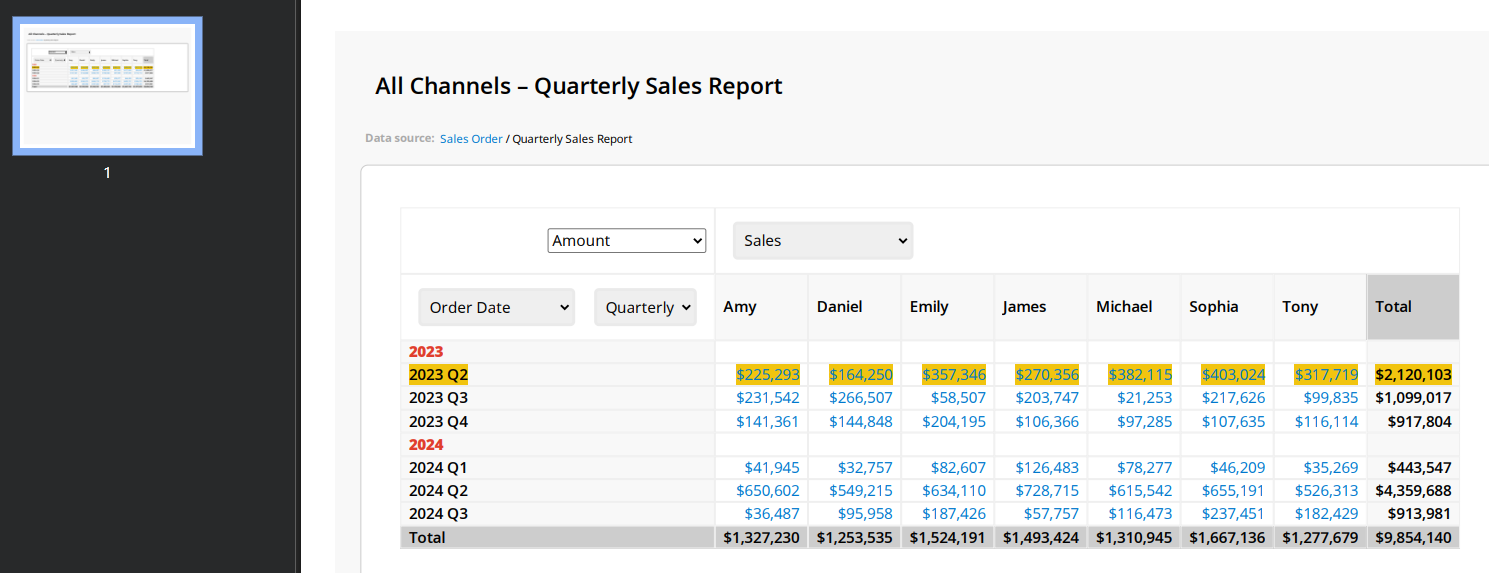
For example, in a "Sales Order" Ranking report, you can filter by product name in the Subtable to analyze the sales performance of a specific product.
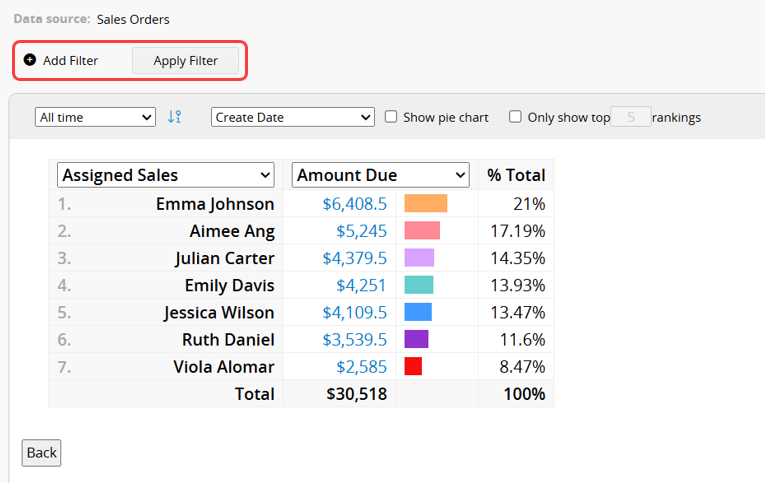
After adding filter conditions, click "Apply Filter" to view the filtered report. You can also add multiple fields as filter conditions.
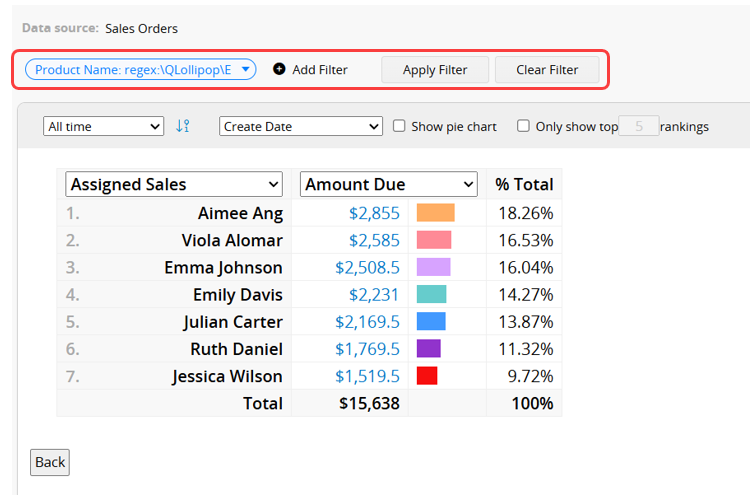
Hover over a filter field to remove that specific condition, or click "Clear Filter" to reset all filter settings.
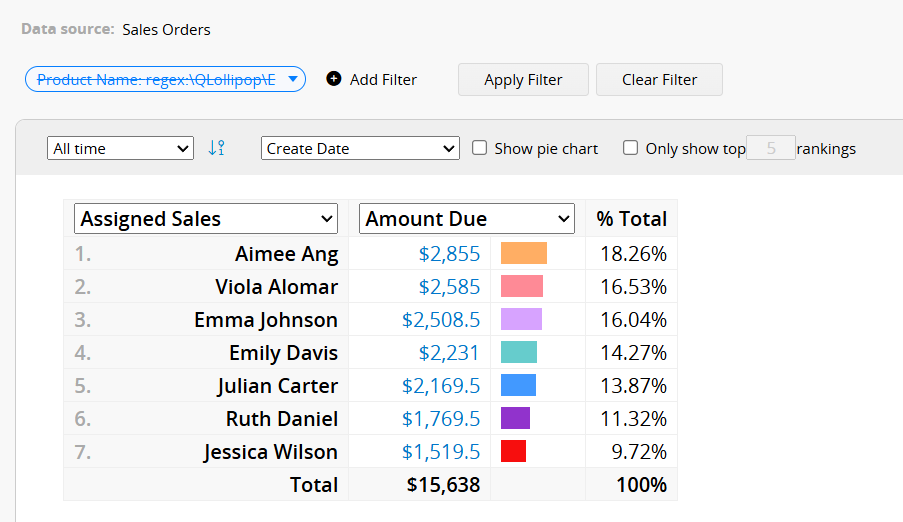
Note: Only fields configured in the left sidebar search tool, Listing Page, or as preset filters in the Report Settings when saving the report will be available as filter options.
1. When a report includes both a preset filter and a Shared View, the system combines their conditions and displays the results if they do not conflict. If the conditions conflict, the later-applied filter will override the previous one.
2. If the sheet has a Fixed Filter, all other filters will be applied based on the Fixed Filter results.
For example, if the Fixed Filter is set to "Orders from this year" and the user selects "Last year" in the preset filter or the filter fields above the report, no results will be displayed.
3. Since the filter fields above the report cannot be saved, if you want a saved report to always apply a specific filter when opened, it is recommended to save a Shared View, apply it to the report, and then save the report.
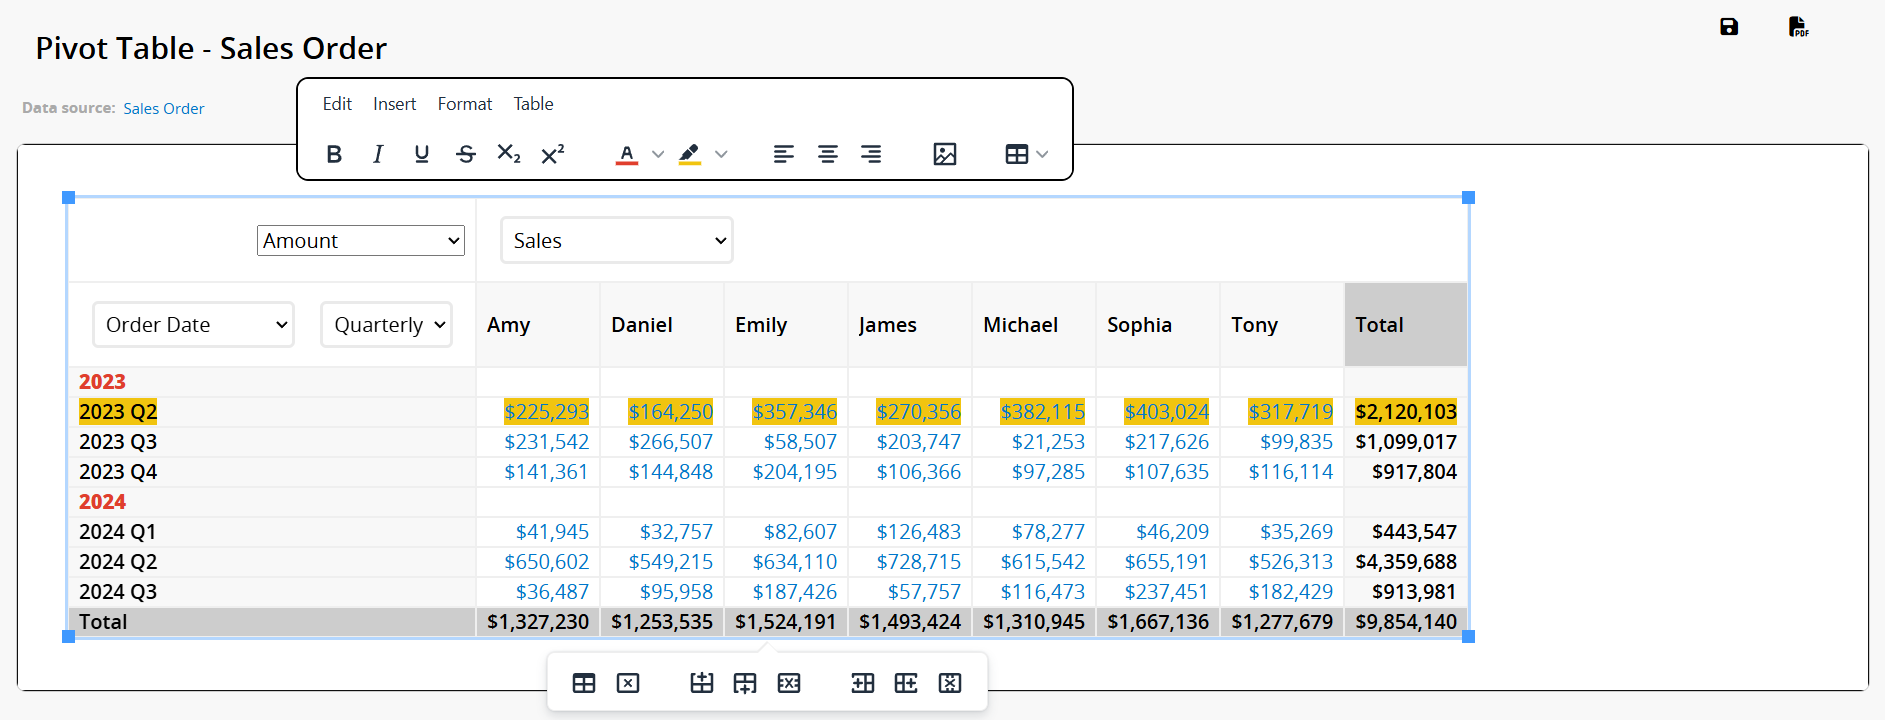
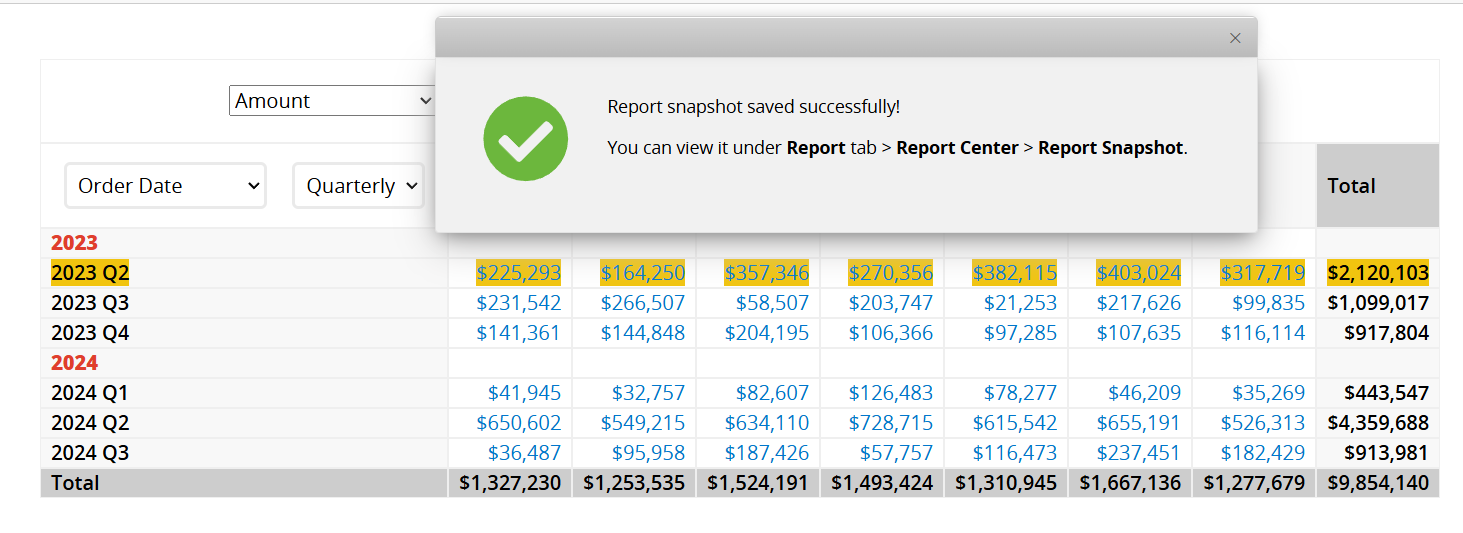
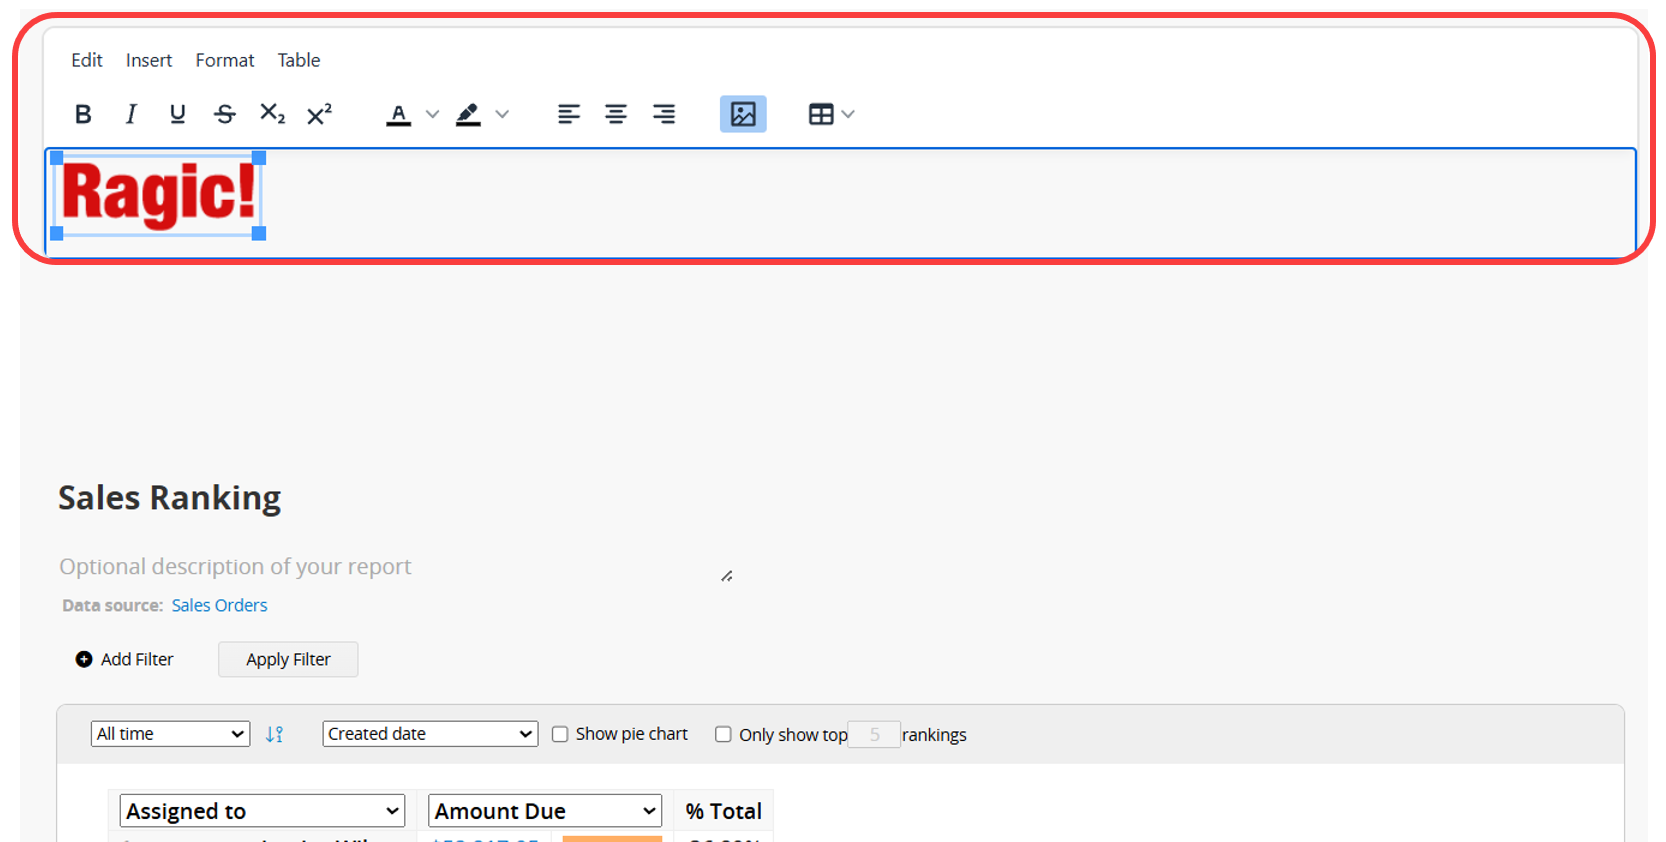
Sometimes you may want to highlight data, apply styles to the report content (for example, bold, underline, or font color), add explanatory text, or remove unnecessary data without using filters. In these cases, you can use the Generate Report Snapshot feature.
Click the ![]() icon in the upper right corner of the report to open a new window. In this window, clicking the white area outside the report will display a toolbar that allows you to insert text, images, or tables, as well as adjust the report’s formatting. For example, you can apply bold or underline to values or change font colors. (Values shown in Line Graph, Bar Chart, Pie Chart, and Dual Axis Chart visuals cannot be adjusted.) For table based reports, you can also add or remove columns, modify table styles, and add text descriptions.
icon in the upper right corner of the report to open a new window. In this window, clicking the white area outside the report will display a toolbar that allows you to insert text, images, or tables, as well as adjust the report’s formatting. For example, you can apply bold or underline to values or change font colors. (Values shown in Line Graph, Bar Chart, Pie Chart, and Dual Axis Chart visuals cannot be adjusted.) For table based reports, you can also add or remove columns, modify table styles, and add text descriptions.
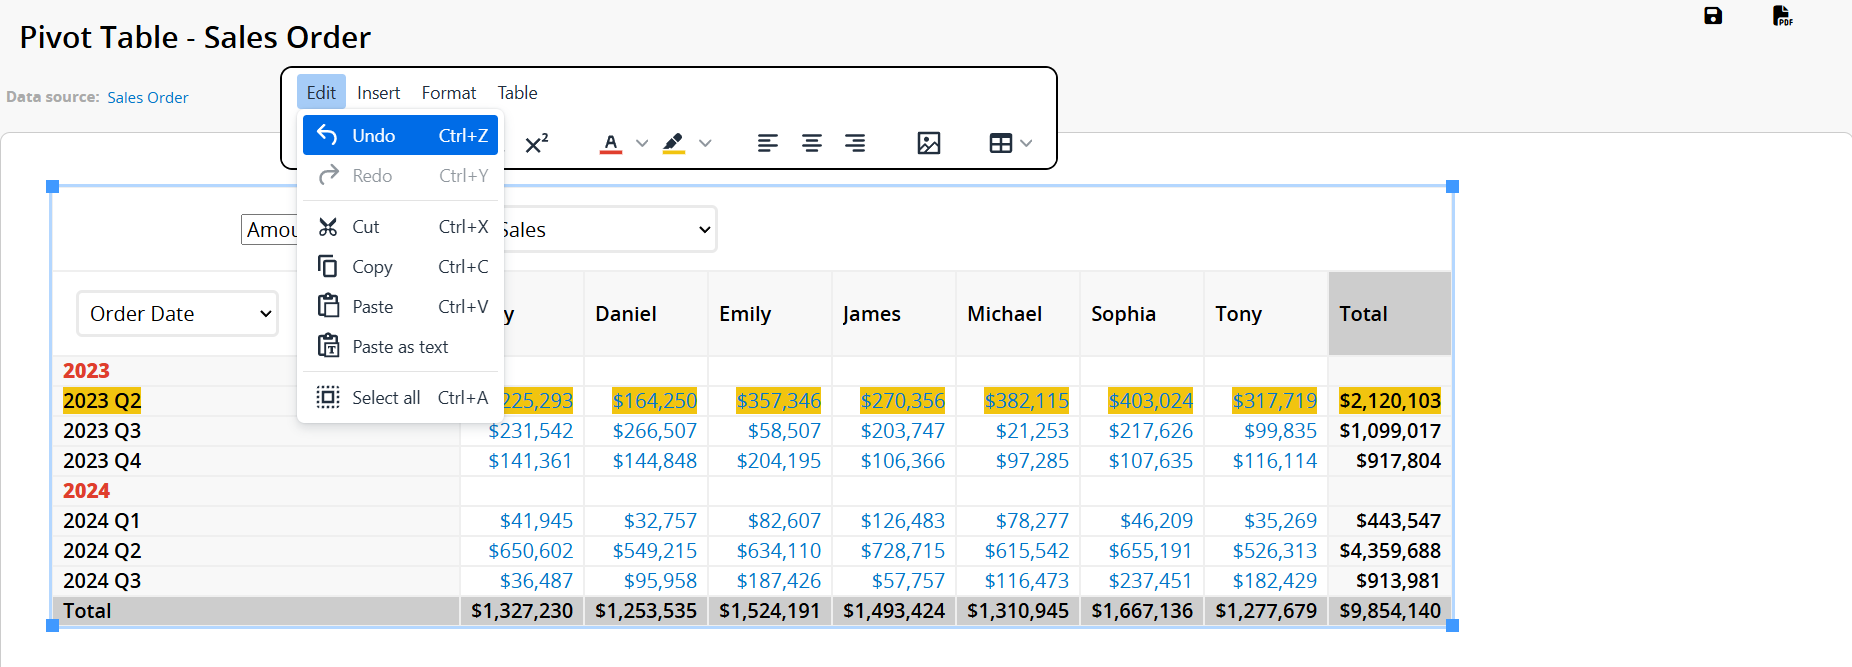
If you need to go back to the previous step, click "Edit" and select "Undo", or use the Ctrl+Z shortcut.
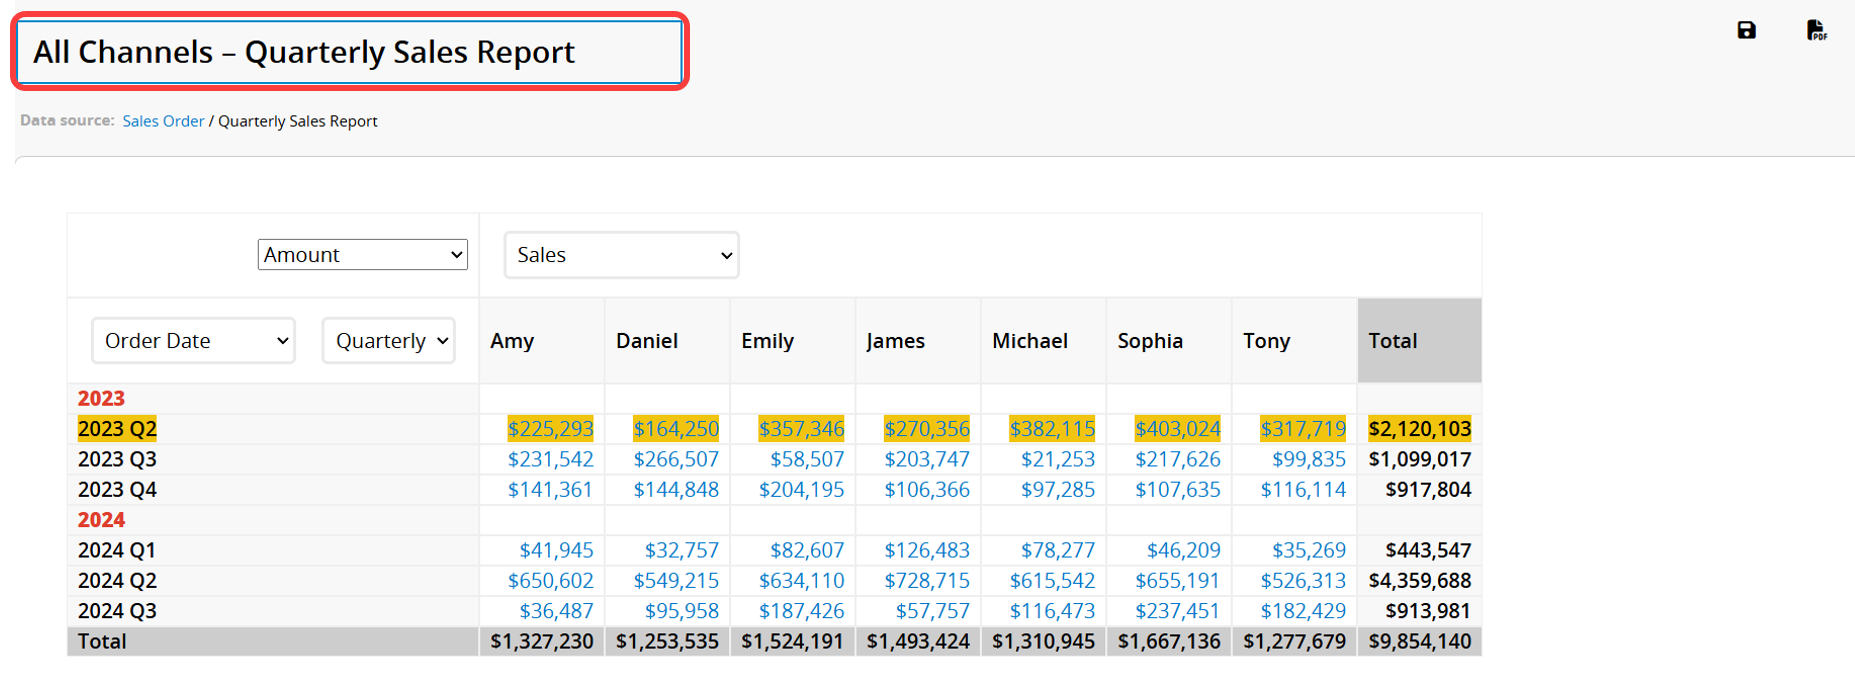
You can name the snapshot at the top of the page.
After completing your edits, click the ![]() icon in the upper right corner to download the snapshot as a PDF. This makes your report more flexible, clearer to read, and easier to share.
icon in the upper right corner to download the snapshot as a PDF. This makes your report more flexible, clearer to read, and easier to share.
Note: If the PDF output appears incomplete, try adjusting the report dimensions or the PDF export size.
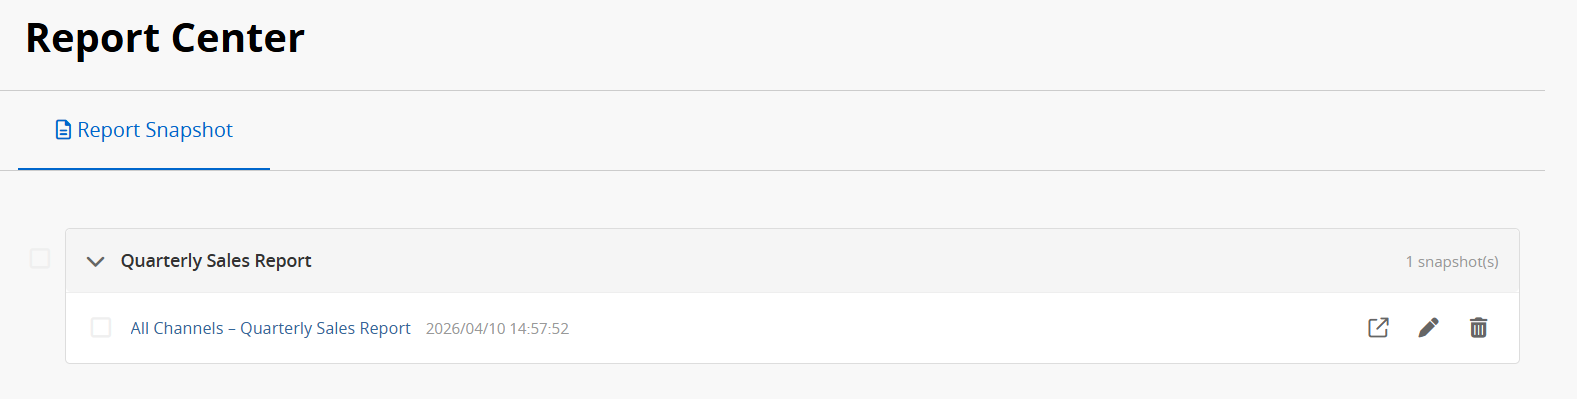
You can also click the ![]() icon in the upper right corner to save the snapshot to the Report Center, where you can view it at any time.
icon in the upper right corner to save the snapshot to the Report Center, where you can view it at any time.
Note: Snapshots saved to the Report Center cannot be edited and can only be downloaded as a PDF.
You can embed the report into your website or send a link to others.
Click on ![]() at the top right and select Embed Report.
at the top right and select Embed Report.
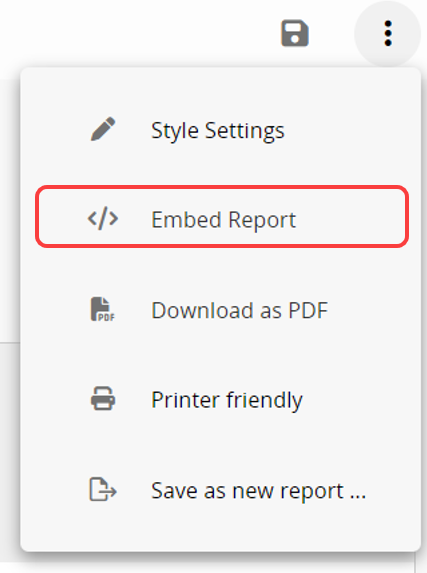
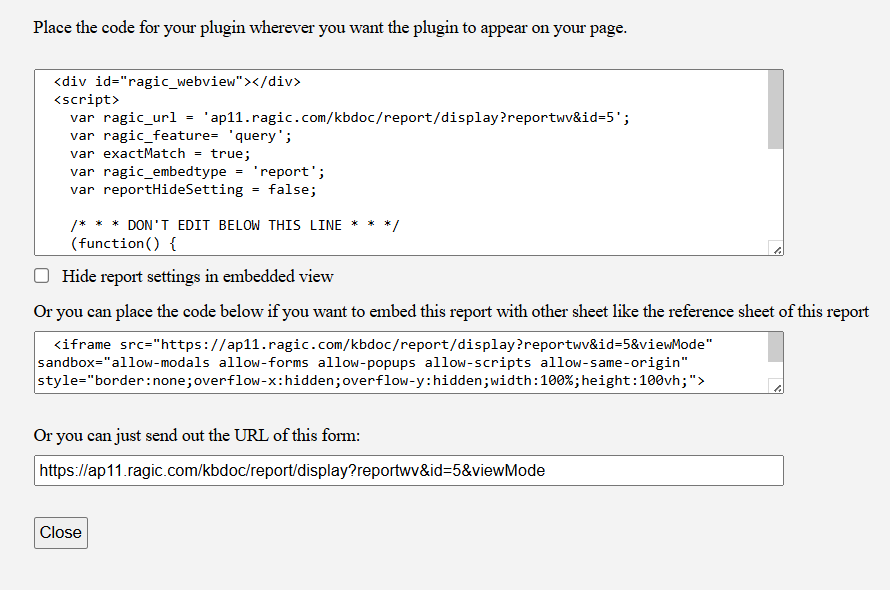
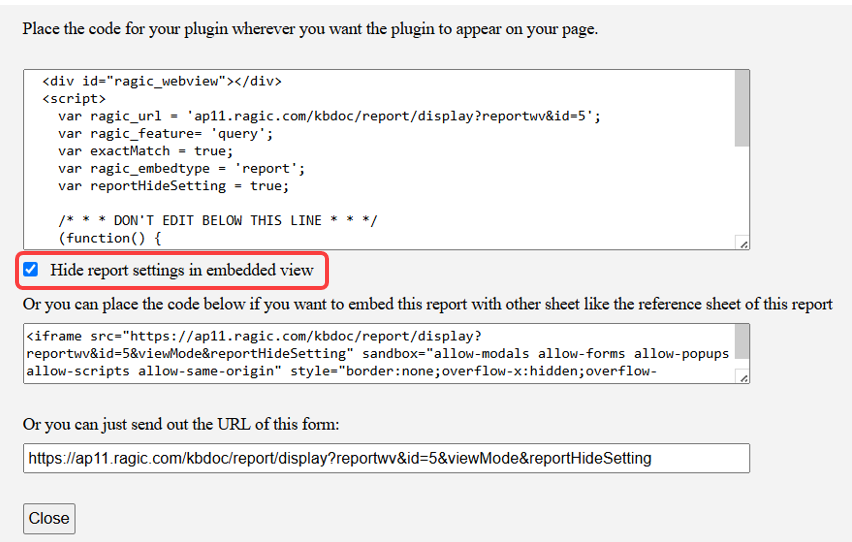
If you do not want the report settings section to display on an embedded page, check Hide report settings in embedded view。
The system determines the user’s location based on their IP address and displays the corresponding language. This may result in the embedded report page displaying a language that is different from the user’s preferred language, and the language cannot be adjusted through the Ragic interface. In this case, you can manually set the display language for the report by adding the lang=language parameter to the embedded URL.
For example, to display the report in Japanese:
Original URL parameter:
https://ap11.ragic.com/kbdoc/report/display?reportwv&id=28&viewMode
Adjusted URL parameter:
https://ap11.ragic.com/kbdoc/report/display?reportwv&id=28&viewMode&lang=ja
The following languages are currently supported, and all parameters must be in lowercase:
| Language | Parameter |
|---|---|
| English | en |
| Spanish | es |
| French | fr |
| Japanese | ja |
| Traditional Chinese | zh-tw、tw |
| Simplified Chinese | zh-cn、cn |
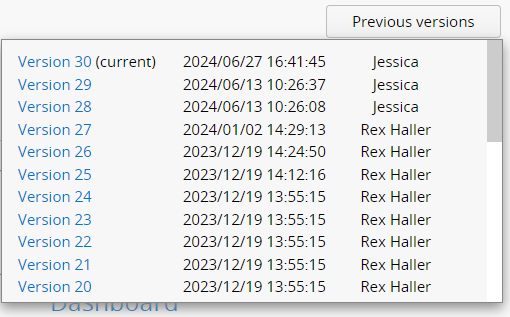
Click New Report under the Reports tab, then click Previous versions in the top right corner. Choose the version you wish to restore.
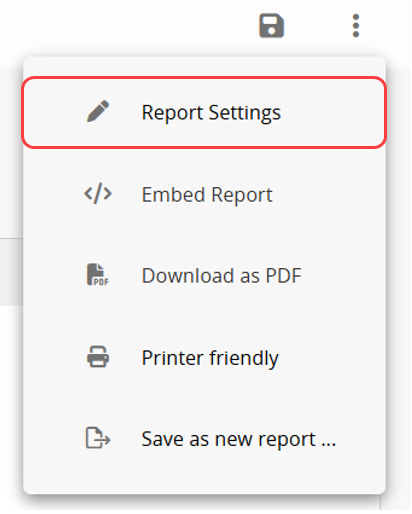
You can configure the style of any report by clicking ![]() in the top right corner and selecting Report Settings.
in the top right corner and selecting Report Settings.
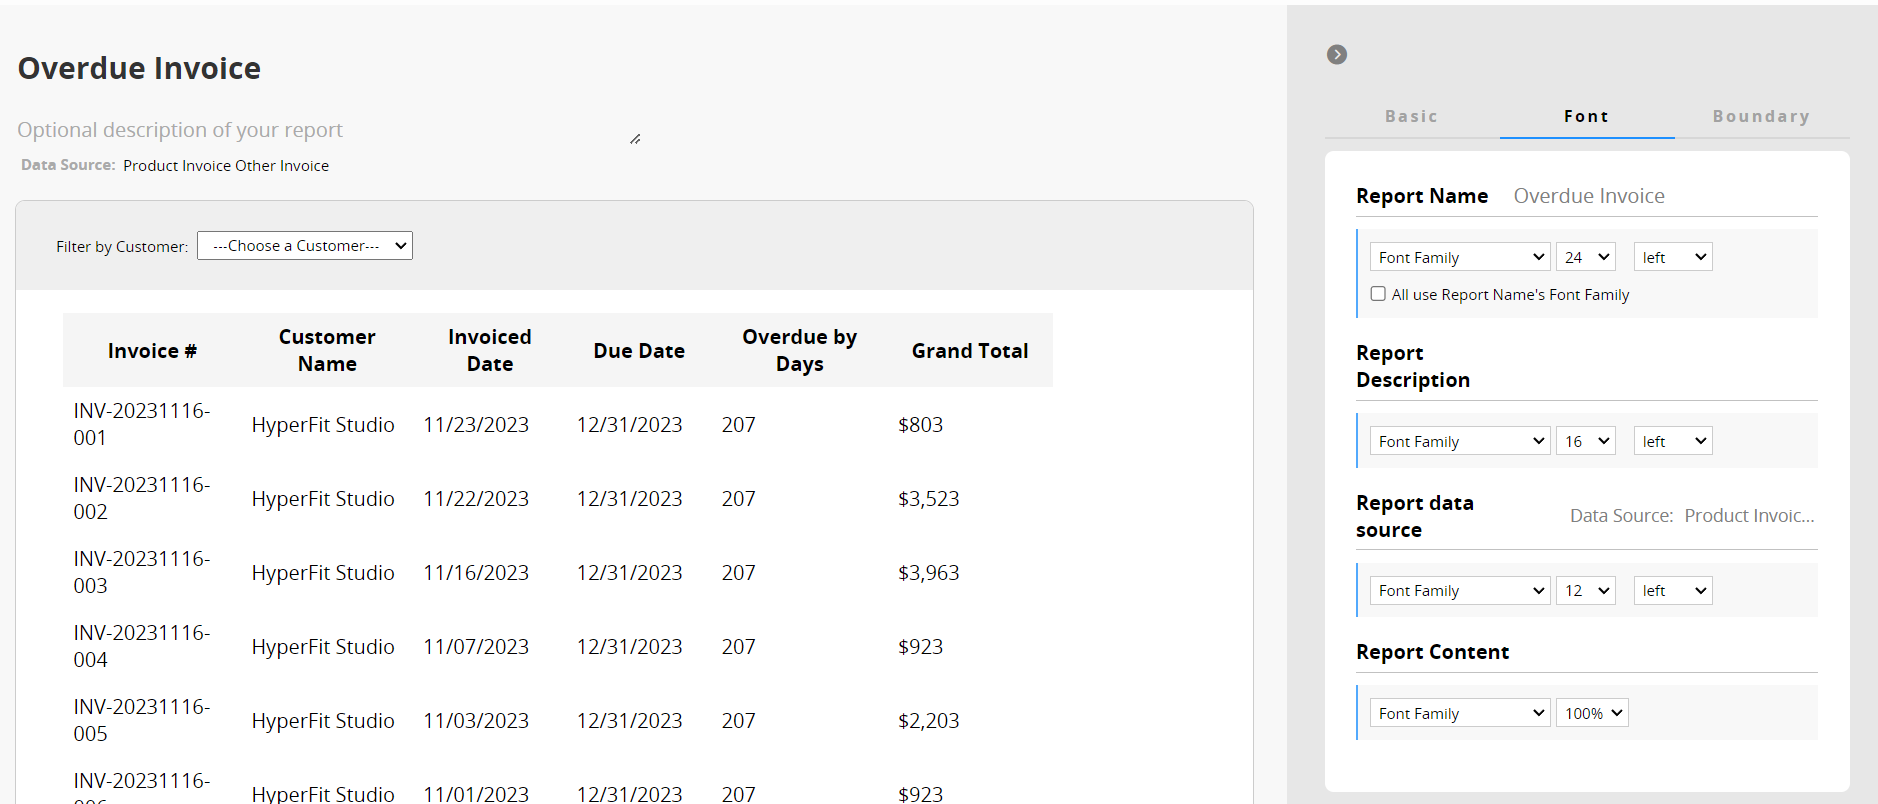
The Report Settings include three sections: Basic, Font, and Boundary.
In addition to modifying the report name and description, you can adjust the following settings:
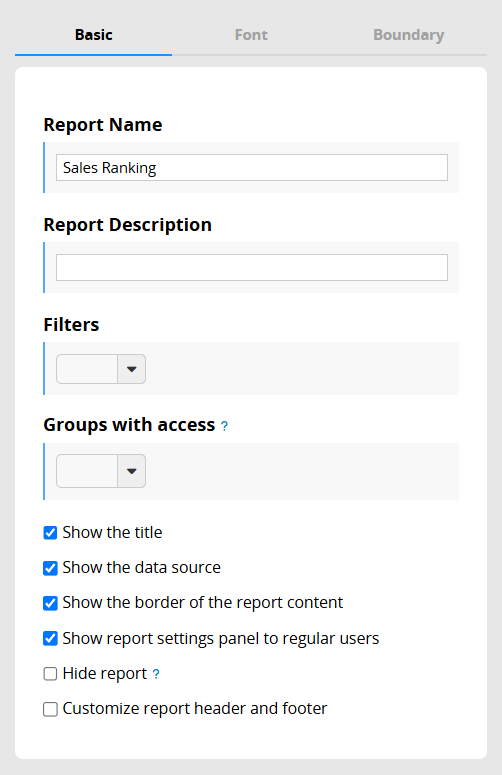
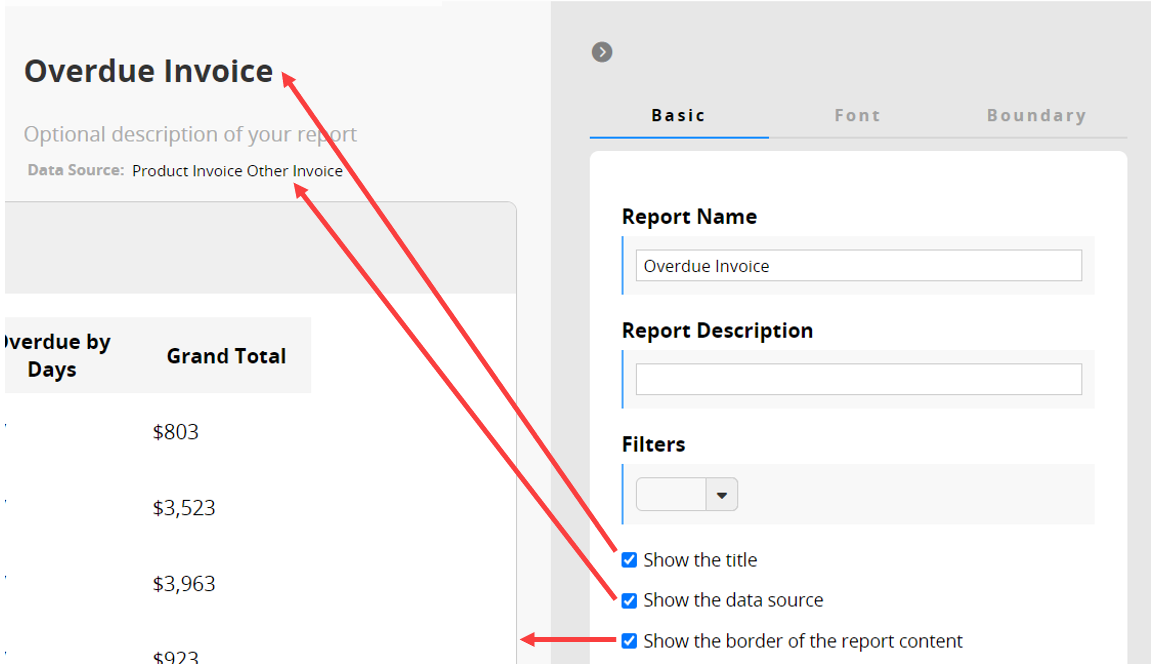
Report display content: see the image below.
Filter: Allow users to apply filters to these fields before using the report.
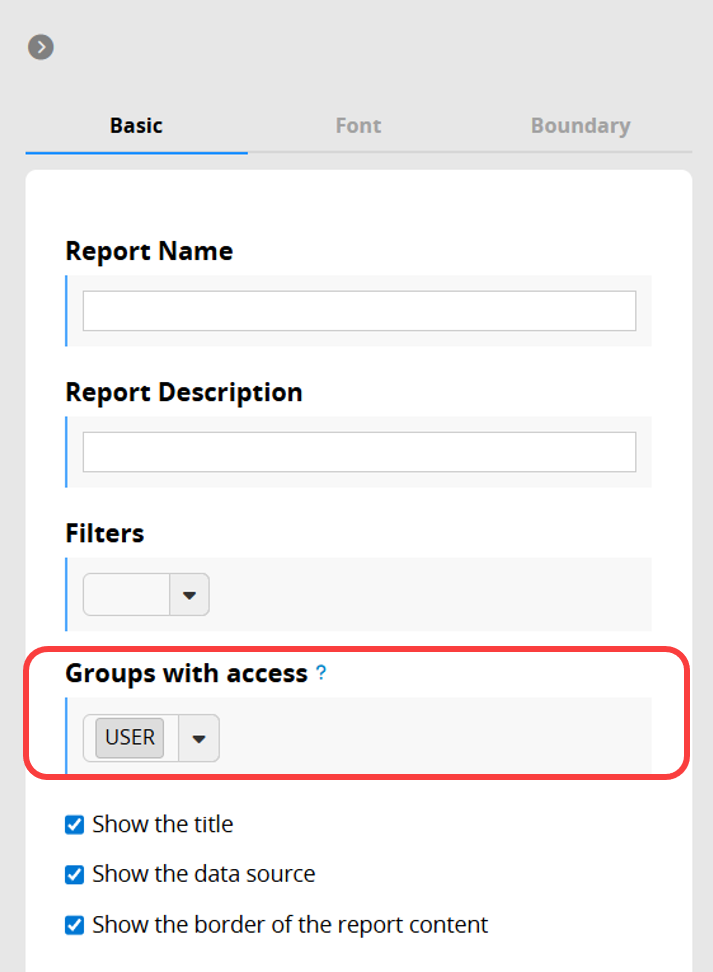
Groups with access: Please refer to the Report Access Rights section.
Show report settings panel to regular users: Checked by default. Clear it if you do not want regular users to adjust settings at the top of the report.
Hide report: When checked, this report will be hidden from non-SYSAdmin users on the database homepage and Tab Menu Set, but still accessible via embedded link or report URL.
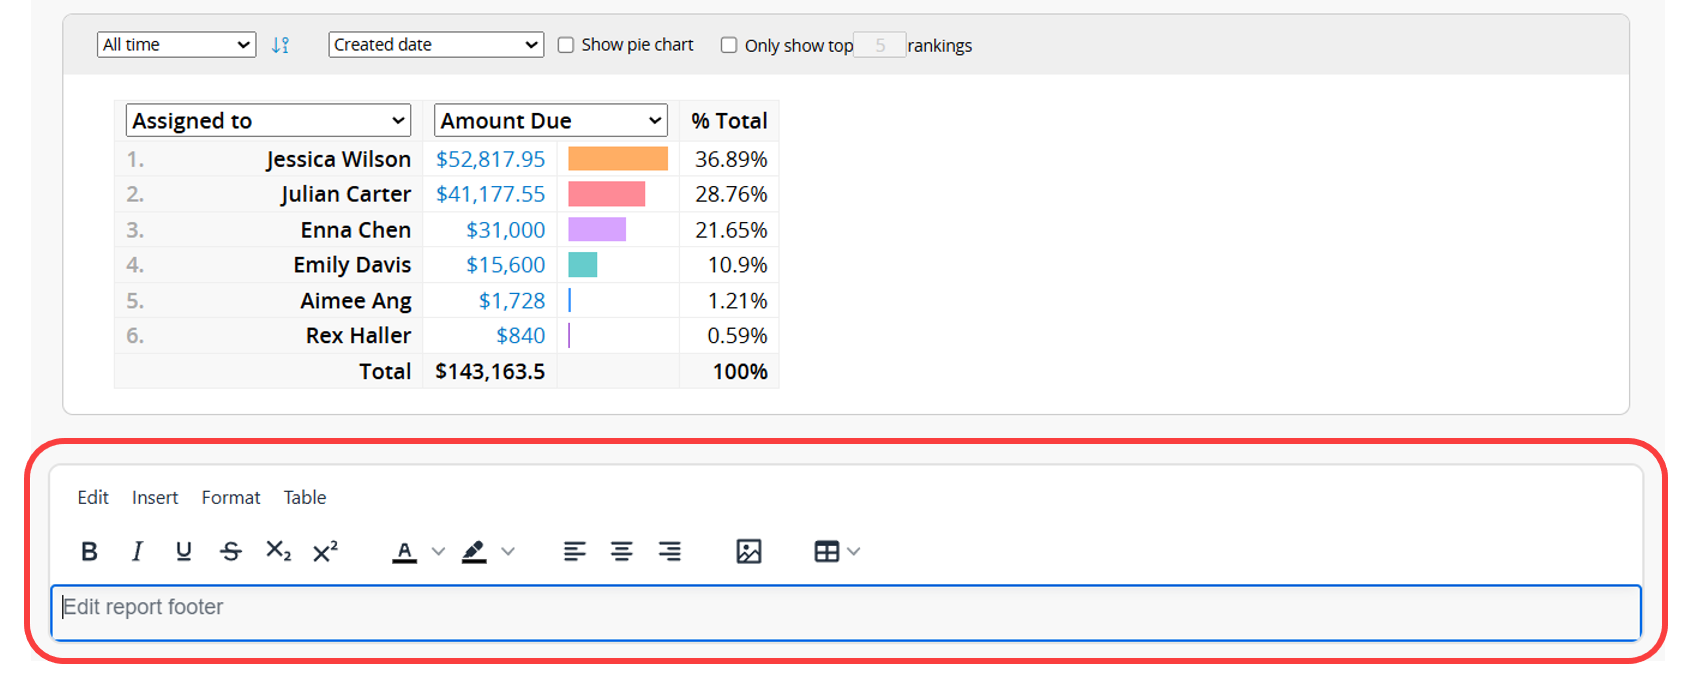
Customize report header and footer: When enabled, you can customize the header and footer of the report, with support for text editing, inserting images (e.g. company logo), tables, and more. (Address Mapping, Reservation System, and User Status Report do not support this feature.)
For specific Reports, you can configure the following settings:
Grouping Report: Select Insert page break after each group while printing.
Label Maker: Configure printing settings.
You can adjust the font type, font size, and alignment.
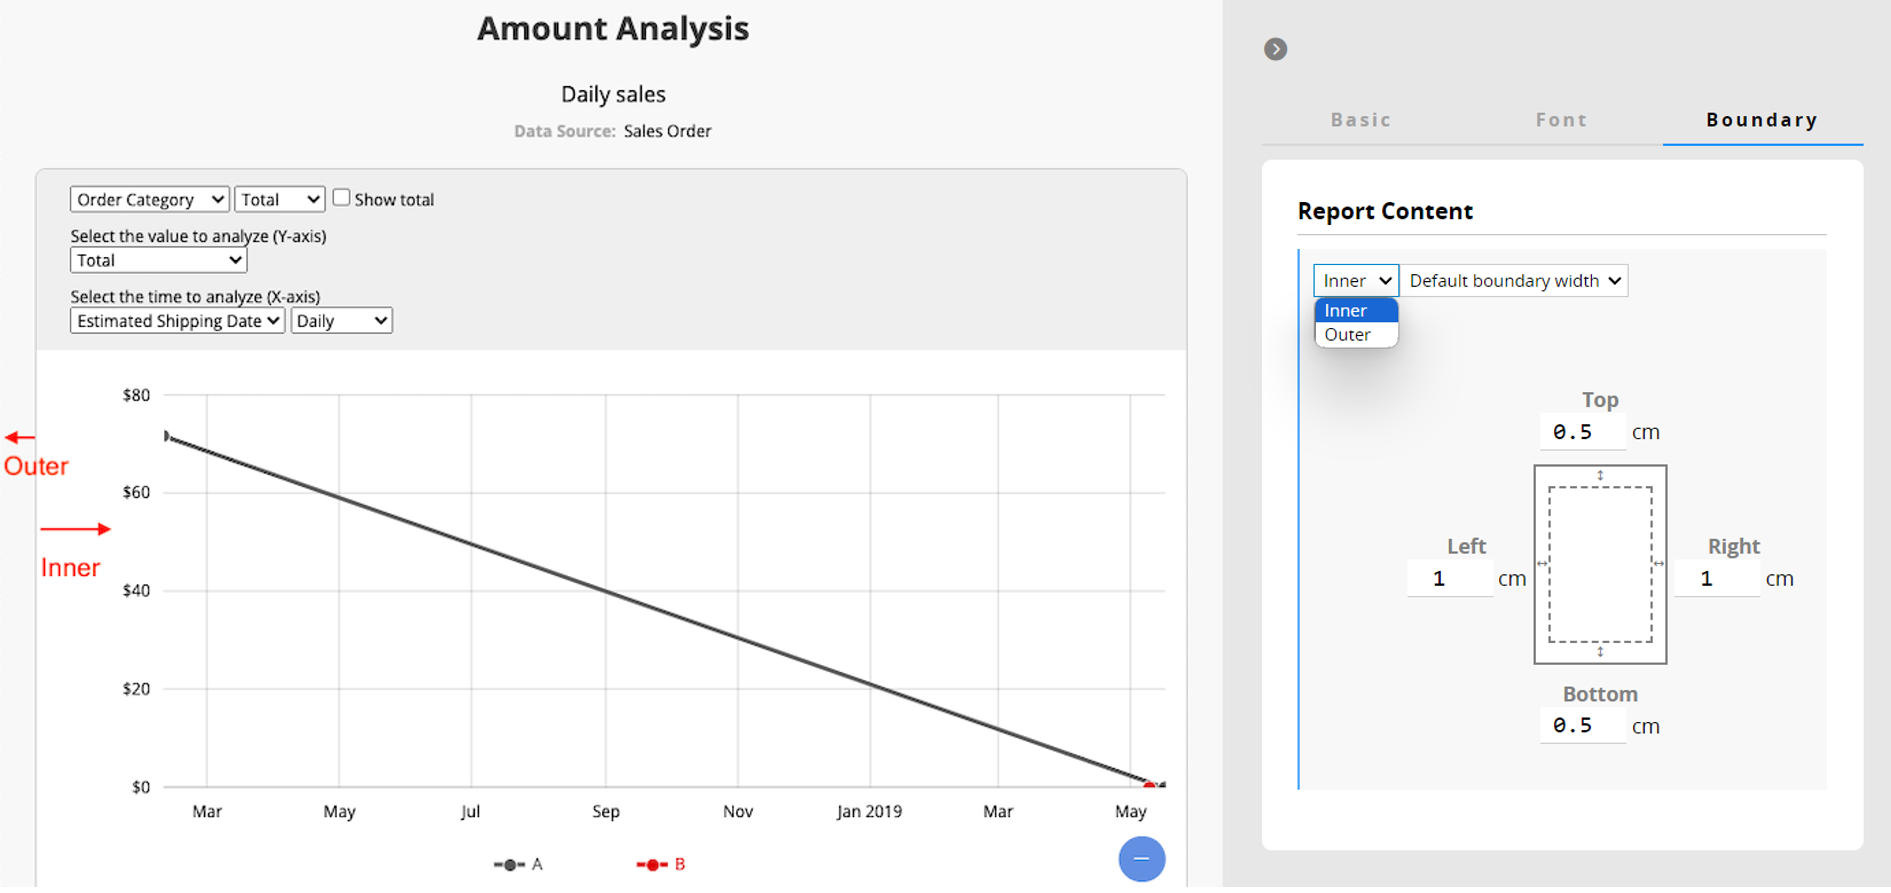
You can modify both the "inner" and "outer" boundaries of the report:
Inner Boundary: The distance between the border and the report content.
Outer Boundary: The distance between the border and the edge of the browser.
SYSAdmin can generate and save reports. By default, normal internal users can generate reports, while both internal and external users can view reports saved by SYSAdmin.
In the Basic section of the Report Settings, the Groups with access field lists the groups with source Sheet Access Rights. This setting further limits which of those groups can view the report. If left blank, the report will follow the source sheet’s Access Rights.
Note: The results displayed will only include the records the user is able to view.
If you want only specific groups of users to generate or view saved reports, you can further adjust Feature Access Settings. Note that View Reports cannot be granted without also granting permission to Generate Reports.
Follow the video below to learn about reports step by step!
 Thank you for your valuable feedback!
