
Using Ragic with Google Sheets
You can share the links you have generated with the Publish to the Web tool directly to allow others to download data in different formats.
You may also import your data with third party tools that allow you to import from a URL.
Ragic + Google Sheets
In the example below, we're using Google Sheets to further analyze our data.
You can view the example Ragic database here, and the example Google Sheet here.
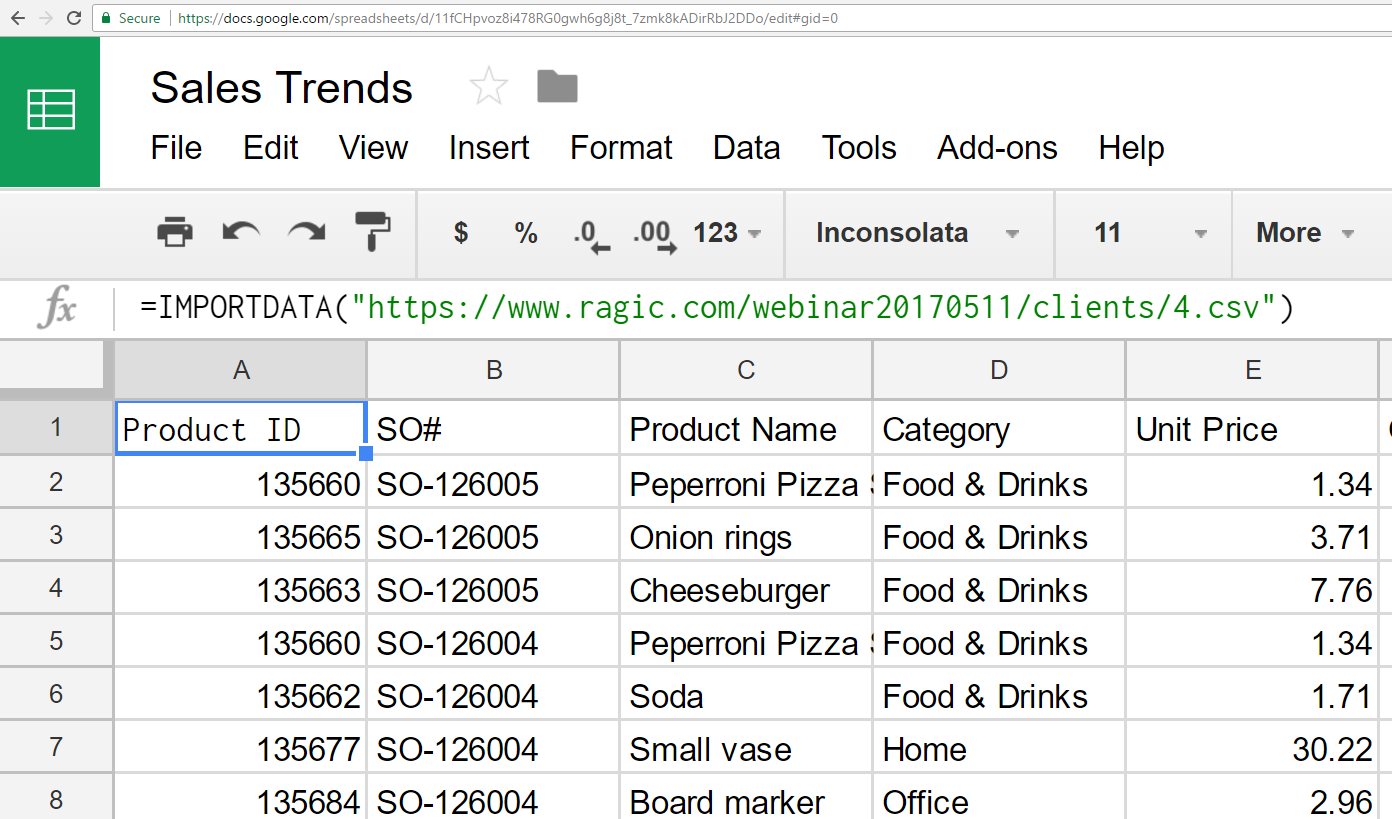
Using the IMPORTDATA formula with the .csv format, we can import data into our spreadsheet from our Ragic database sheet.

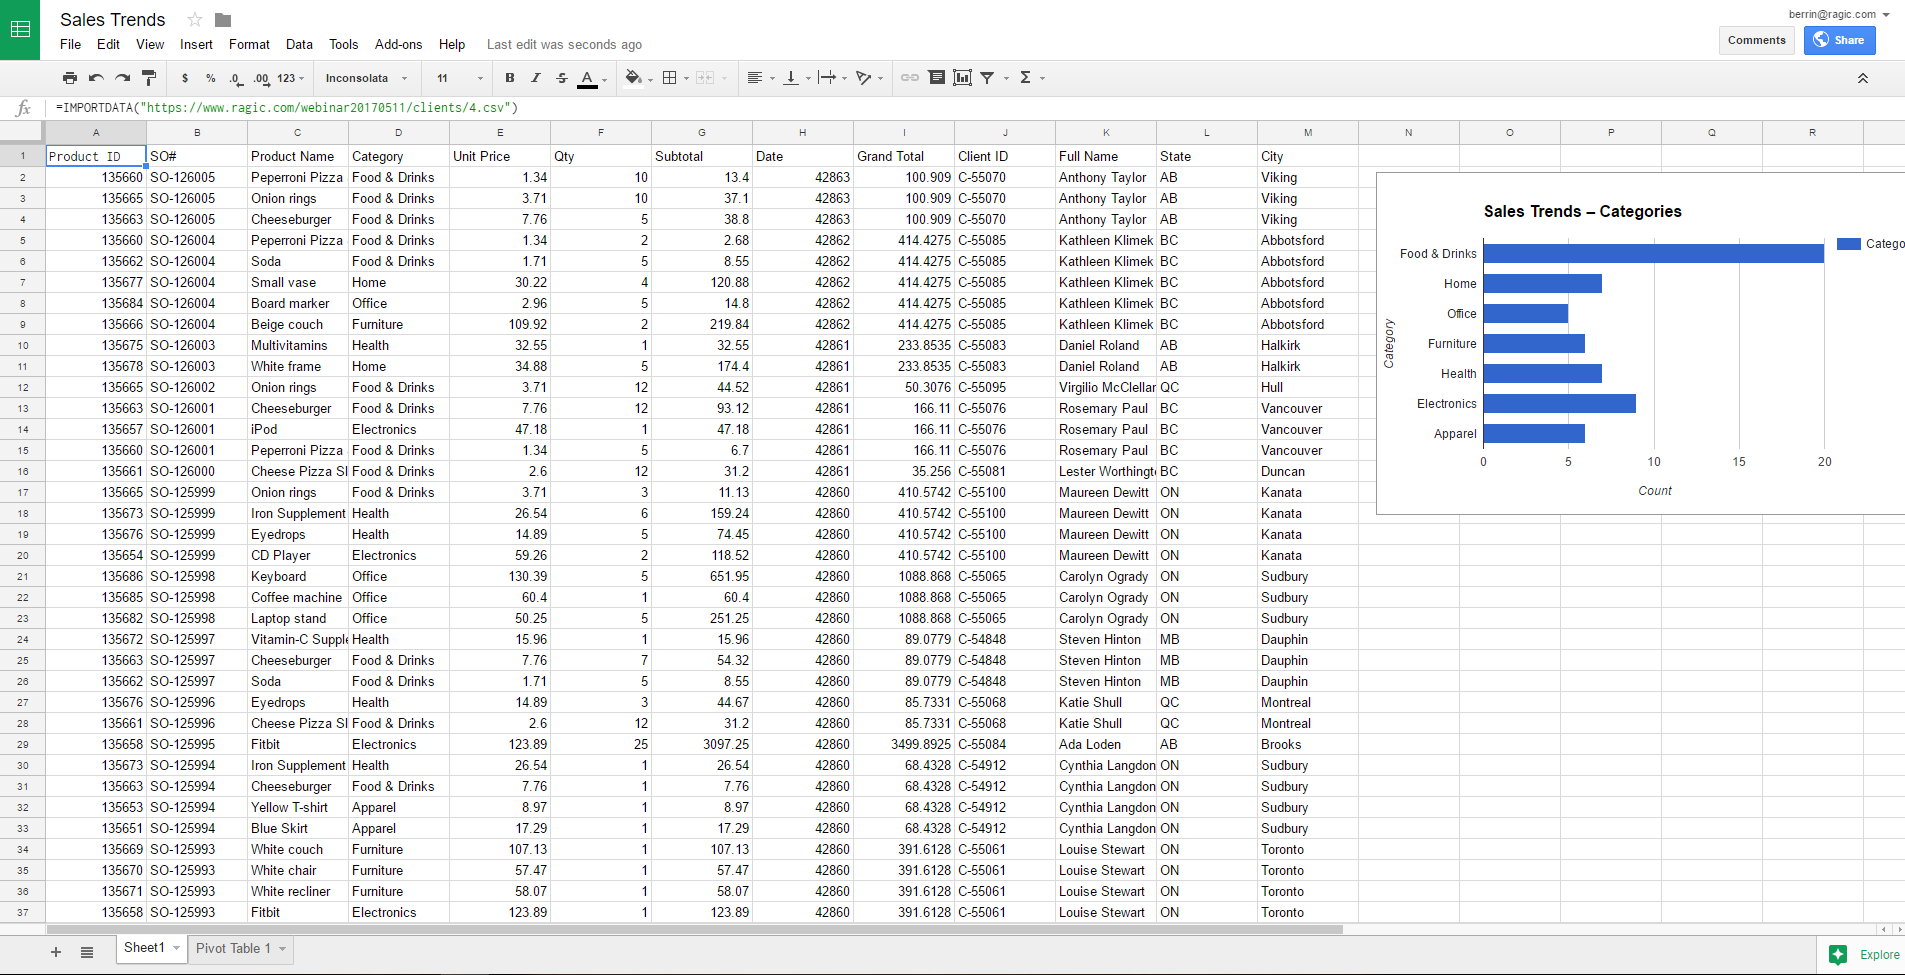
Using this data, we can create charts with different criteria using the Charts tool.
This pivot table was created by selecting the range of data on the spreadsheet, and navigating to Data > Pivot Table.
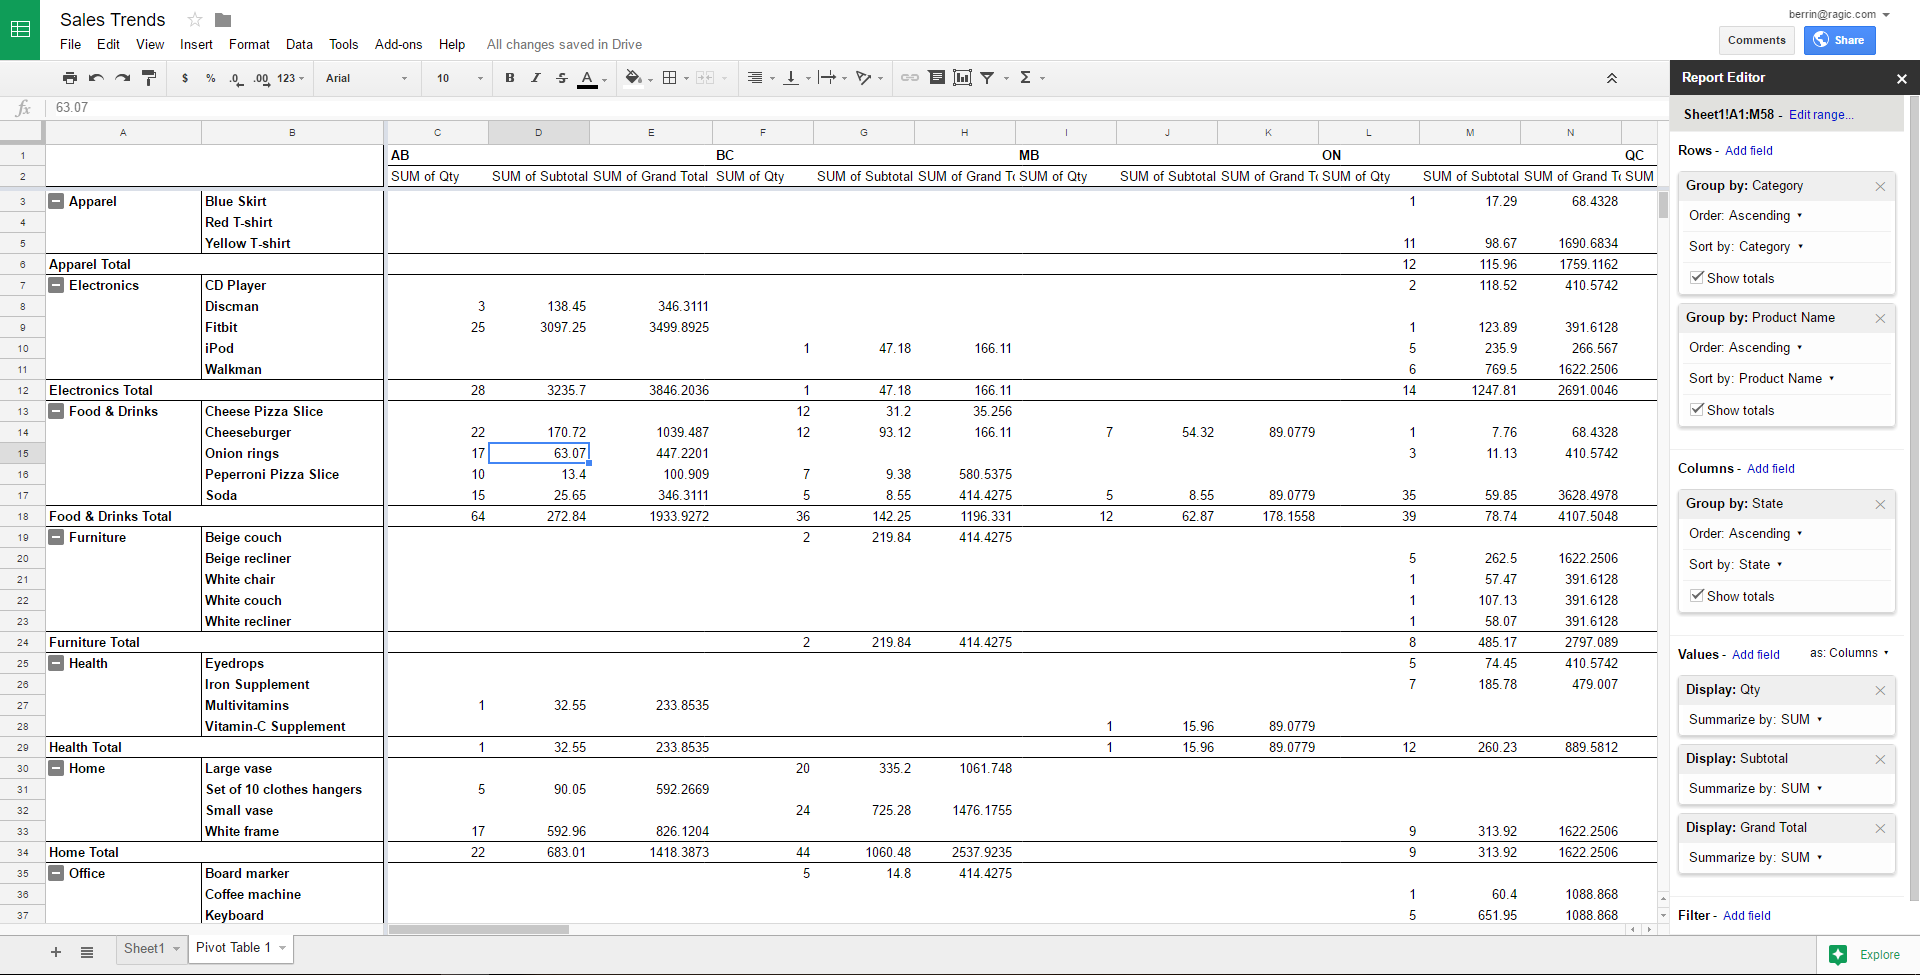
Using the Report Editor menu, we can use multiple criteria to group fields, and display values accordingly. On our example, since we can use different criteria and stack them within the pivot table, we're able to group our products in our example under different product categories.
More information about pivot tables on Google Sheets can be found here.
Category: Talking Ragic > Learn Ragic

