
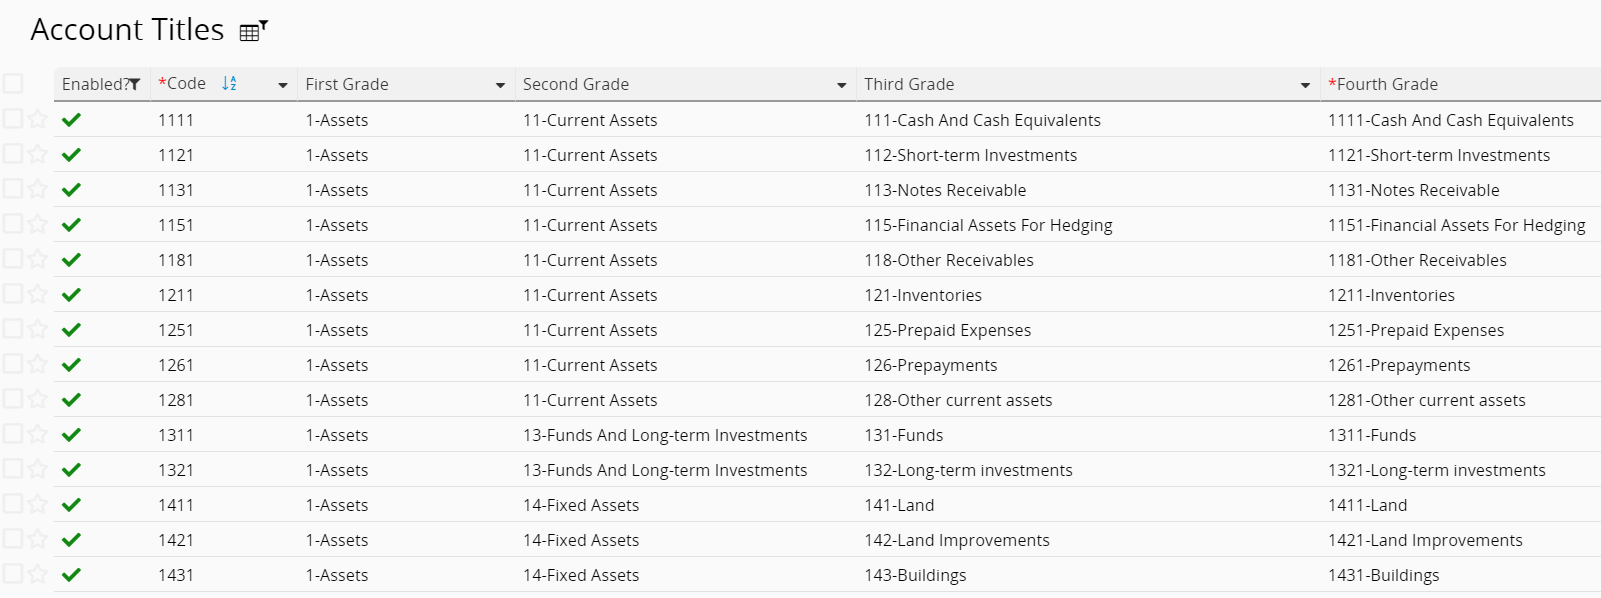
A Chart of Accounts (COA) is the list of items a business uses to classify and record its financial transactions. Each item in this list is called an "account"—such as cash, accounts receivable, sales revenue, or payroll expense—used to record different types of financial activity.
Each account is typically assigned a unique code and name, making it easy to manage, look up, and aggregate consistently within a system, and ensuring financial statements are produced according to a consistent classification logic. Businesses build their chart of accounts based on their industry characteristics, management needs, and reporting objectives, and it serves as the foundation for day-to-day bookkeeping and financial management. As a result, even companies in the same industry may use different account names, coding conventions, and levels of classification.
In practice, the chart of accounts directly determines how a business records each transaction. For example, when a sale occurs, the system records the revenue under "Sales Revenue" and the amount owed under "Accounts Receivable," based on the configured chart of accounts; when payroll is paid or a purchase expense is incurred, these are recorded under accounts such as "Payroll Expense" or "Cost of Goods Purchased." This ensures all financial activity is properly classified and tracked.
The chart of accounts can be considered the foundational structure of a financial system's operation—it determines how a business breaks down and presents its accounting information, as well as the level of detail available for subsequent reporting and analysis.
1. Standardizes Financial Classification: A unified account structure ensures all financial transactions are classified according to consistent rules, avoiding confusion or duplicate recording.
2. Supports Financial Statement Generation: Reports such as the income statement and balance sheet rely on the chart of accounts as their data source and classification basis.
3. Enhances Financial Analysis Capabilities: A well-designed, detailed account structure allows businesses to more precisely analyze cost structure and revenue sources.
A typical business's chart of accounts is generally divided into the following major categories:
Accounts are typically designed in a hierarchical structure (category → classification → account → sub-account). This layered breakdown ensures financial data meets statutory reporting requirements while also supporting internal management analysis.
Most businesses adopt a three-level account structure:
When businesses need more granular analysis, they can extend the hierarchy further or add analytical dimensions:
In system implementations (such as Ragic), the default structure is usually sufficient to cover a standard four-level account hierarchy, allowing financial statements to move seamlessly from high-level categories down to individual transaction details.
Account codes typically map strictly to the account hierarchy, allowing the nature and classification of an account to be quickly identified from its numeric code. A typical account coding structure works as follows:
Coding example: A code of 1101 might break down as: 1 (Assets) + 1 (Current Assets) + 01 (Cash).
Practical recommendations:
Sort Order: The chart of accounts list within a system is strictly sorted by account code, ensuring consistency when looking up account records.
Flexible Design: The coding length described above is a common standard. When implementing Ragic or an ERP system, businesses can extend the number of digits (e.g., to 6 or 8 digits) depending on the level of management detail needed, to support more granular sub-account management.
Actual Definition: The final code length and the exact meaning of each digit should follow the accounting system officially adopted internally by the business.
In practice, there is no single standardized chart of accounts that applies to all private businesses and can simply be downloaded and used. While core accounting principles (IFRS or GAAP) are consistent, the actual account design varies depending on industry and management needs.
1. Government Agencies and Public Sector Entities (Fixed Standards)
Government agencies and public sector entities typically follow strict, standardized accounting frameworks, such as:
2. Private Businesses (Custom-Designed Based on Needs)
Private businesses design their own chart of accounts based on the complexity of their operations, with key differences including:
Recommendations for system setup:
When implementing a system, it's advisable to reference the financial statements of similar companies in the same industry, or consult the chart of accounts provided by an outsourced bookkeeping firm or accounting office as a baseline. From there, extend to a fourth level or add dimensional fields based on internal management goals (e.g., whether profit-and-loss visibility is needed by business unit).
In ERP or financial systems, the chart of accounts is the foundational configuration for classifying and posting financial data—nearly every transaction is recorded and organized according to this structure. For example:
Through a standardized chart of accounts, businesses can keep their account classification and recording methods consistent—reducing manual entry errors while making financial information easier to understand and analyze.